
Searching the Help
To search for information in the Help, type a word or phrase in the Search box. When you enter a group of words, OR is inferred. You can use Boolean operators to refine your search.
Results returned are case insensitive. However, results ranking takes case into account and assigns higher scores to case matches. Therefore, a search for "cats" followed by a search for "Cats" would return the same number of Help topics, but the order in which the topics are listed would be different.
| Search for | Example | Results |
|---|---|---|
| A single word | cat
|
Topics that contain the word "cat". You will also find its grammatical variations, such as "cats". |
|
A phrase. You can specify that the search results contain a specific phrase. |
"cat food" (quotation marks) |
Topics that contain the literal phrase "cat food" and all its grammatical variations. Without the quotation marks, the query is equivalent to specifying an OR operator, which finds topics with one of the individual words instead of the phrase. |
| Search for | Operator | Example |
|---|---|---|
|
Two or more words in the same topic |
|
|
| Either word in a topic |
|
|
| Topics that do not contain a specific word or phrase |
|
|
| Topics that contain one string and do not contain another | ^ (caret) |
cat ^ mouse
|
| A combination of search types | ( ) parentheses |
|


![]()
![]()

PPM_Demo and PPM CAPs
The purpose of the PPM_Demo and PPM Content Acceleration Packs (CAPs) is to provide a set of items (Scorecards, Contexts, KPIs, Metrics, and more) that automatically gathers information from across your enterprise to build key performance indicators (KPIs) related to PPM-related issues with OOTB data from Data Warehouse as well as Dashboard pages that display the relevant information. The CAPs include the Project Portfolio Management Perspectives. The CAPs provide broad and deep insight that should enable you to Align with Business Strategy, improve the Stewardship of IT Investment, Accelerate Agility, and Improve Project Execution. This CAP provides a 360 degree Project and Portfolio Managementview.
The PPM_Demo is based on data in .csv files that are part of the CAP package and PPM CAPs include data from data sources.
The relevant content pack is PPM. For details, see Integration with PPM.
 User Story
-
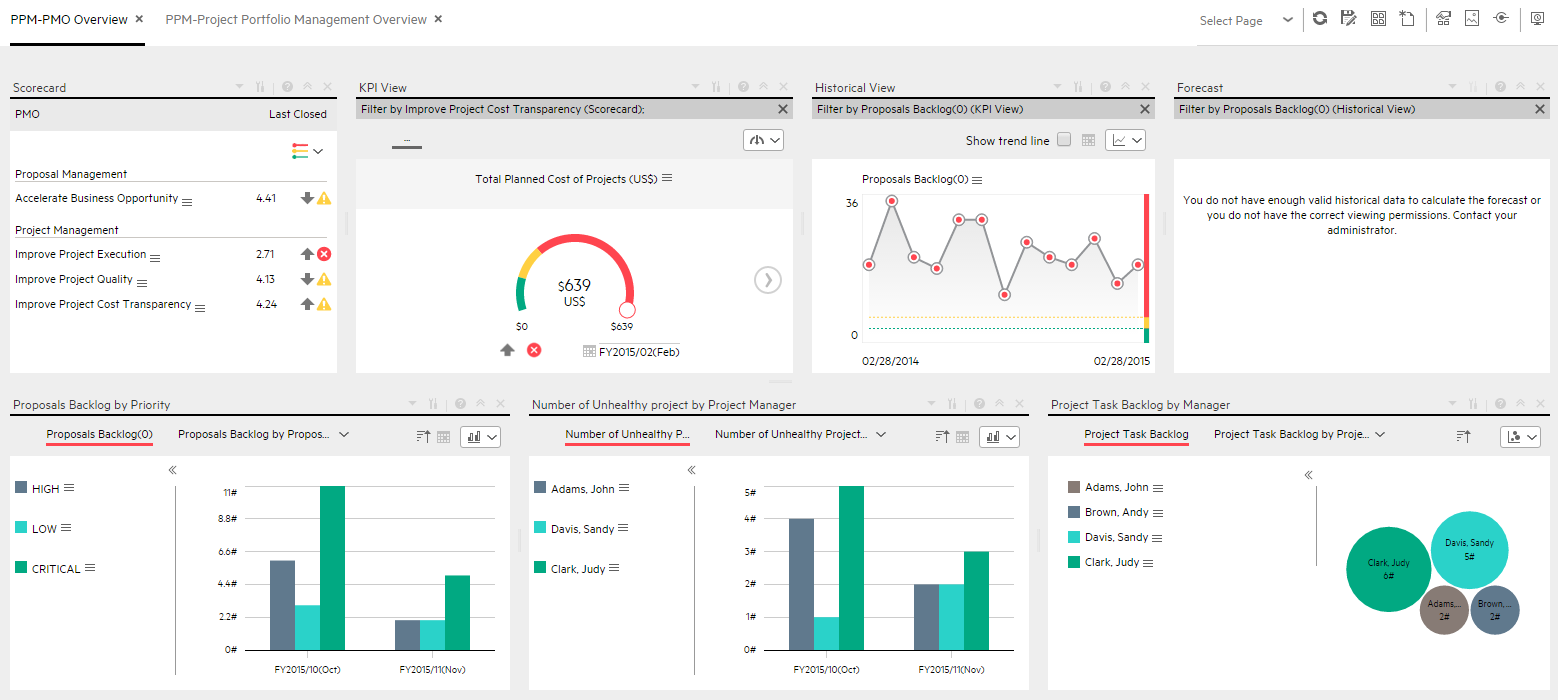
Chris is the Project Management Officer of the IT Operation department. As part of his daily work, he’d like to log into the IT Business Analytics (ITBA) application to understand the overall performance of the projects and proposals within his organization and check if there is any critical issue on the table.
-
He logs into ITBA and launches the PPM-PMO Overview page to view the latest updates of the overall business performance.
-
Chris starts reviewing the PMO Scorecard and under the Project Management perspective, he notices that the status of Improve Project Execution objective is Red.
-
To understand why the Improve Project Execution objective was not met, he clicks the objective and checks the related KPI in the KPI View Component. He notices that the reason for not meeting the Project Execution objective is due to poor performance of many of the KPIs.
-
Chris decides to start his analysis with the Number of Delayed Projects KPI.
-
He clicks the KPI in the KPI View component to view the historical trend of the KPI and check its forecast.
-
He notices that lately, the behavior of this KPI got worse.
-
The KPI granularity is Monthly. He wishes to find the specific day or week this KPI started to be breached. To do so, he clicks the Calendar icon and selects Weekly.
-
The historical results of this KPI are now presented in a weekly resolution.
-
He finds out the specific week when the KPI started to breach.
-
Chris also noticed in the Forecast component that the KPI will continue to be breached in upcoming months and therefore understands that something needs to be done.
-
He continues the drill down to understand which specific project is causing the delay.
-
He clicks the KPI itself and selects Project Name to view a breakdown by projects.
-
Once the component is refreshed with the new data, he changes its view of to Multiple Historical Trend to be able to compare between projects.
-
He clicks each one of the projects listed in the legend and finds out that EPR Financial project is negatively affecting the main KPI result.
-
Chris writes an annotation to Daniel, the owner of the EPR Financial project in the organization, requesting some clarifications.
-
Daniel receives an email from Chris regarding the problematic KPI. He logs on to the ITBA application, checks the same KPI, and sees that indeed the project has been delayed over and over again during the past few months .
-
Daniel sets a meeting with his team to find out why the project was delayed and together they write a plan to overcome the issues.
-
He writes an annotation back to Chris stating that a plan was set to avoid delays and that Chris will see an improvement very soon.
PPM_Demo and PPM
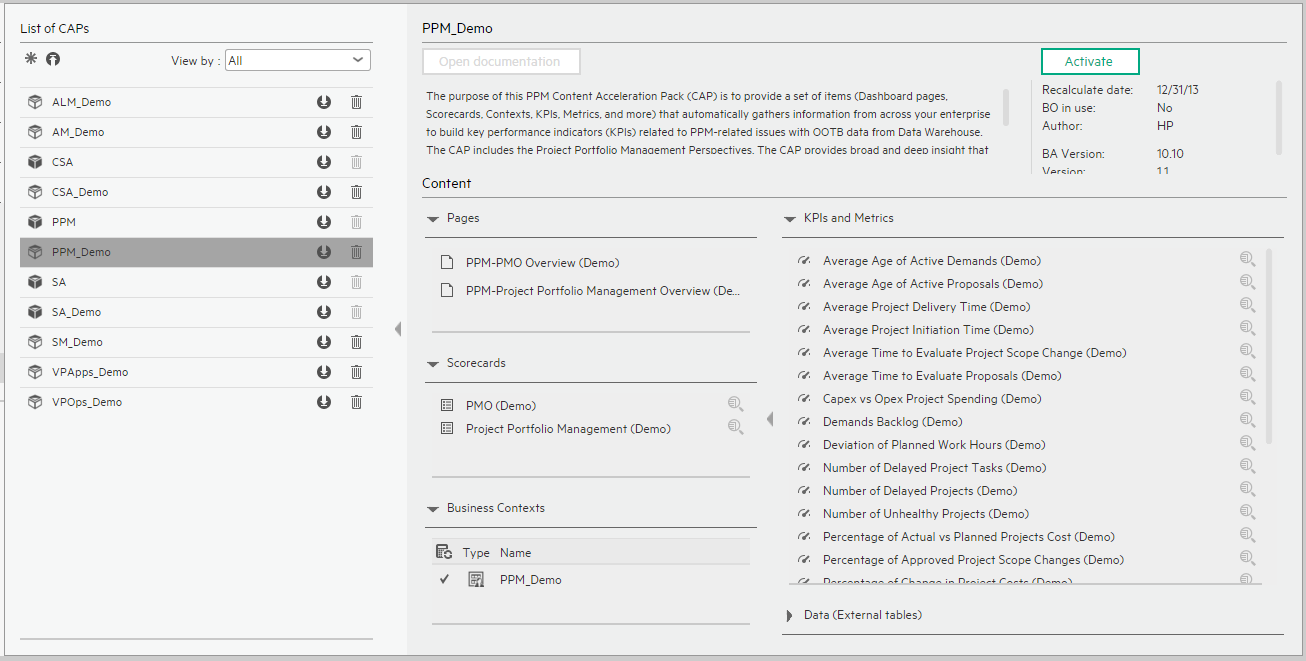
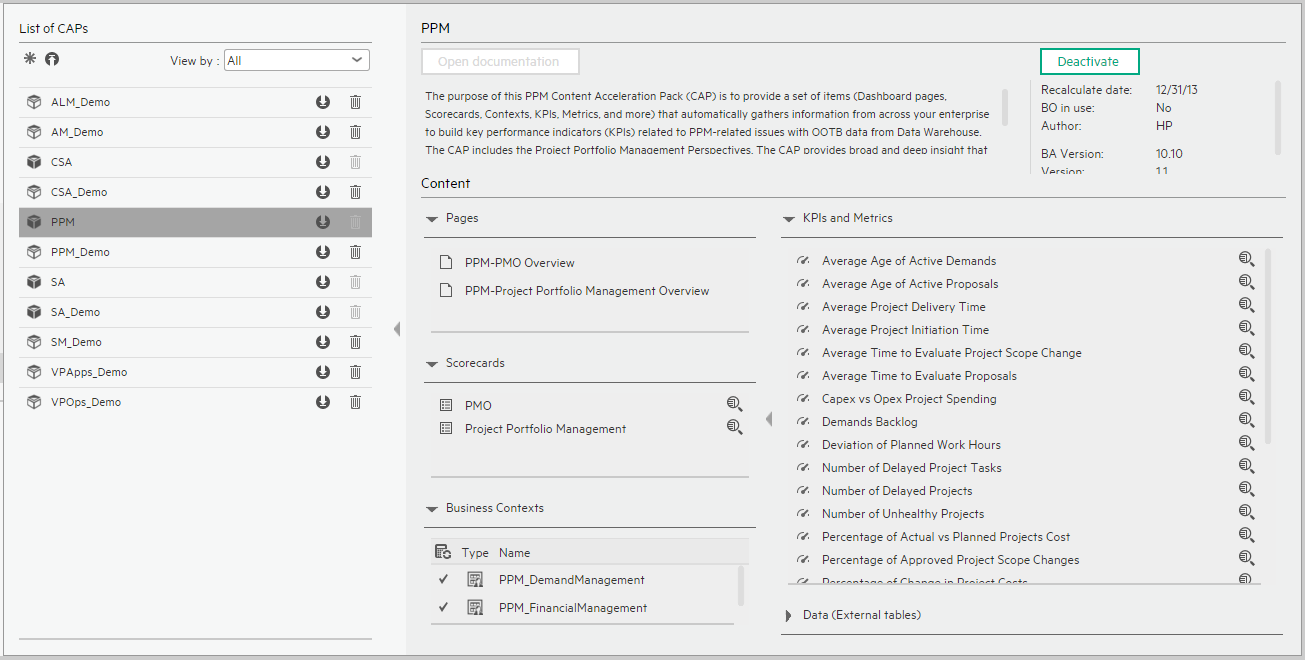
User interface elements are described below (when relevant, unlabeled elements are shown in angle brackets):
|
UI Element |
Description |
|---|---|
| Pages | |
| Scorecards |
|
| Business Contexts |
For details, see Semantic Layer - Contexts and Universes. |
| KPIs and Metrics |
Note The Demo CAP includes KPIs with names followed by (Demo). The CAP includes the same KPIs with names that do not include (Demo). The KPIs are the same but have different names so that both the Demo CAP and the CAP can be activated at the same time.
|
| Data (External Tables) |
|
PPM-PMO Overview Page
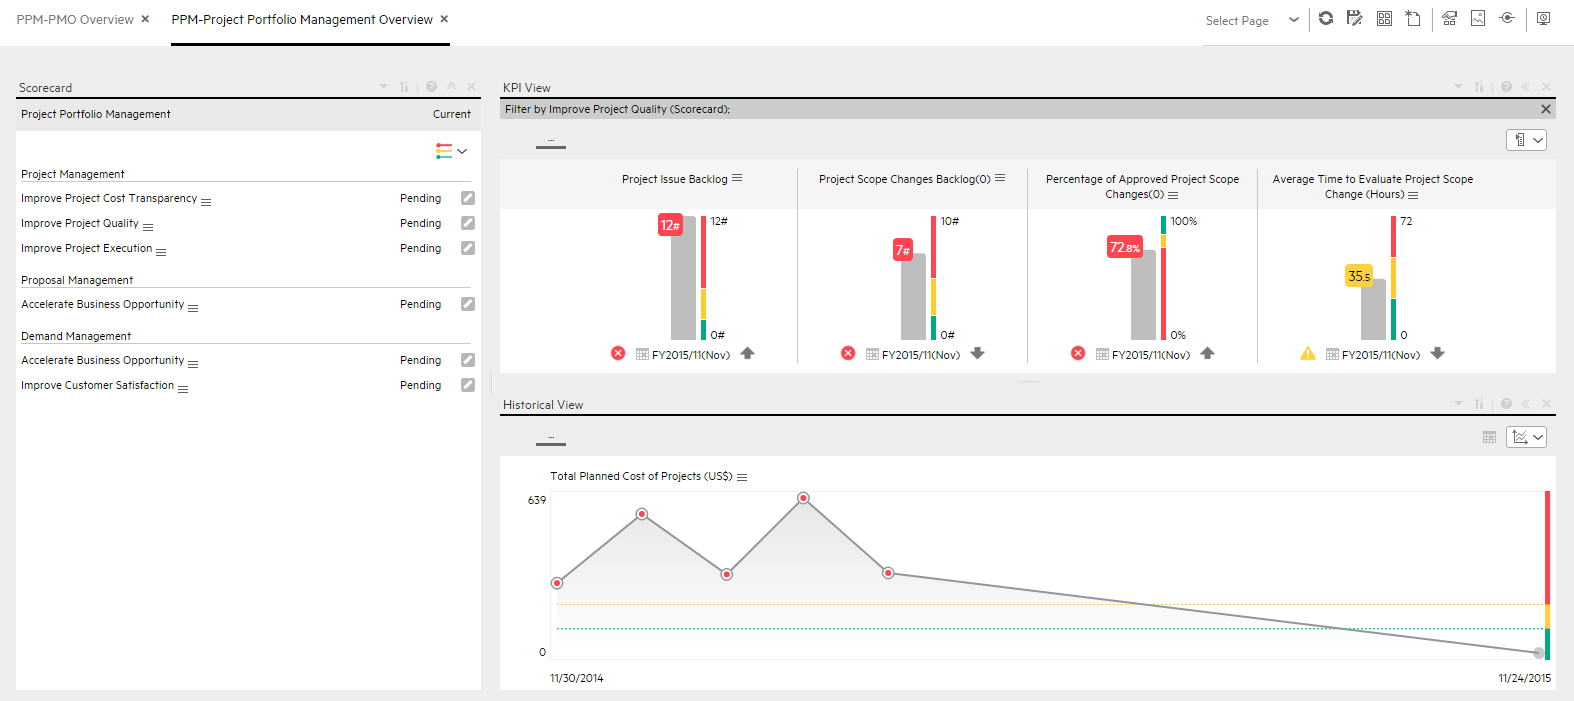
PPM-Project Portfolio Management Overview Page
We welcome your comments!
To open the configured email client on this computer, open an email window.
Otherwise, copy the information below to a web mail client, and send this email to SW-Doc@hpe.com.
Help Topic ID:
Product:
Topic Title:
Feedback: