
Searching the Help
To search for information in the Help, type a word or phrase in the Search box. When you enter a group of words, OR is inferred. You can use Boolean operators to refine your search.
Results returned are case insensitive. However, results ranking takes case into account and assigns higher scores to case matches. Therefore, a search for "cats" followed by a search for "Cats" would return the same number of Help topics, but the order in which the topics are listed would be different.
| Search for | Example | Results |
|---|---|---|
| A single word | cat
|
Topics that contain the word "cat". You will also find its grammatical variations, such as "cats". |
|
A phrase. You can specify that the search results contain a specific phrase. |
"cat food" (quotation marks) |
Topics that contain the literal phrase "cat food" and all its grammatical variations. Without the quotation marks, the query is equivalent to specifying an OR operator, which finds topics with one of the individual words instead of the phrase. |
| Search for | Operator | Example |
|---|---|---|
|
Two or more words in the same topic |
|
|
| Either word in a topic |
|
|
| Topics that do not contain a specific word or phrase |
|
|
| Topics that contain one string and do not contain another | ^ (caret) |
cat ^ mouse
|
| A combination of search types | ( ) parentheses |
|


![]()
![]()

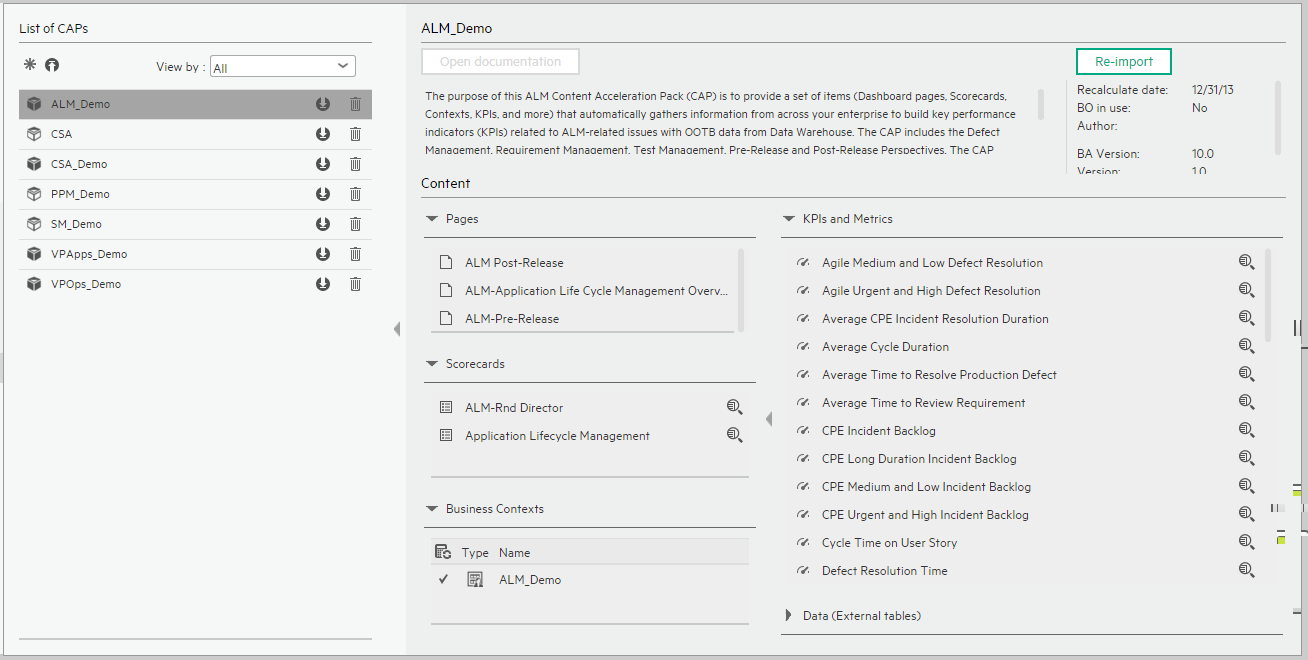
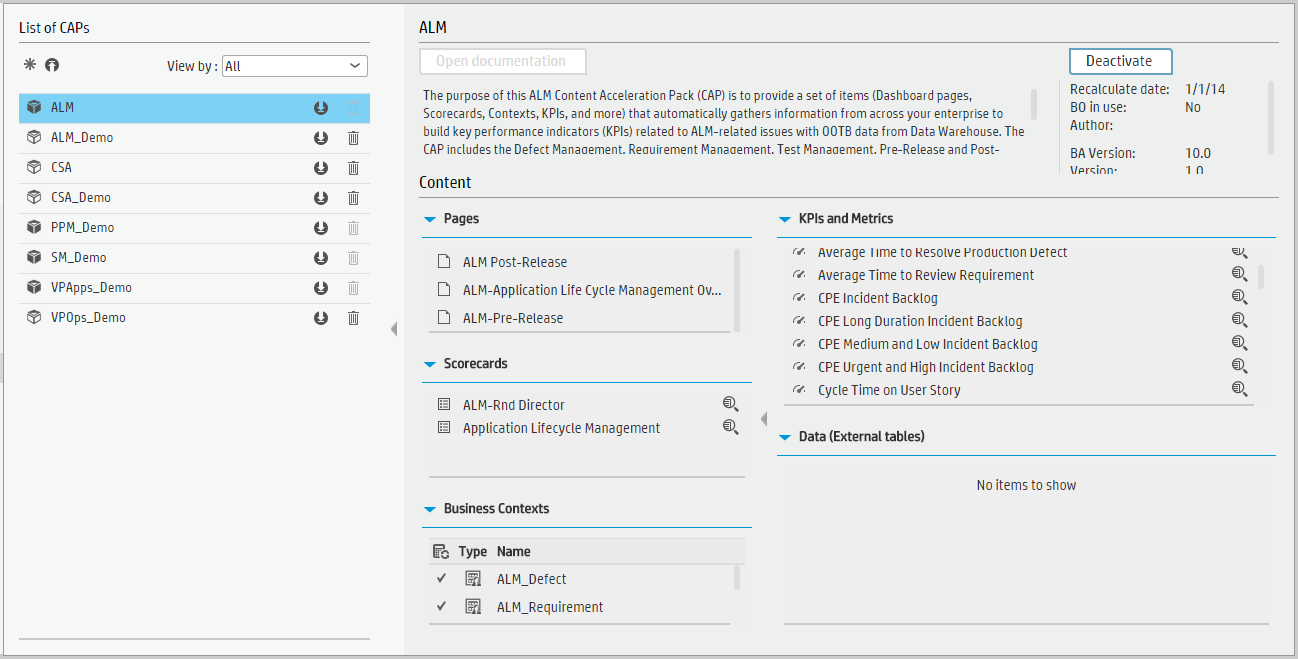
ALM_Demo and ALM CAPs
The purpose of the ALM_Demo and ALM Content Acceleration Packs (CAPs) is to provide a set of items (Scorecards, Contexts, KPIs, Metrics, and more) that automatically gathers information from across your enterprise to build key performance indicators (KPIs) related to ALM-related issues with OOTB data from Data Warehouse as well as Dashboard pages that display the relevant information.
The relevant content pack is ALM. For details, see Integration with ALM.
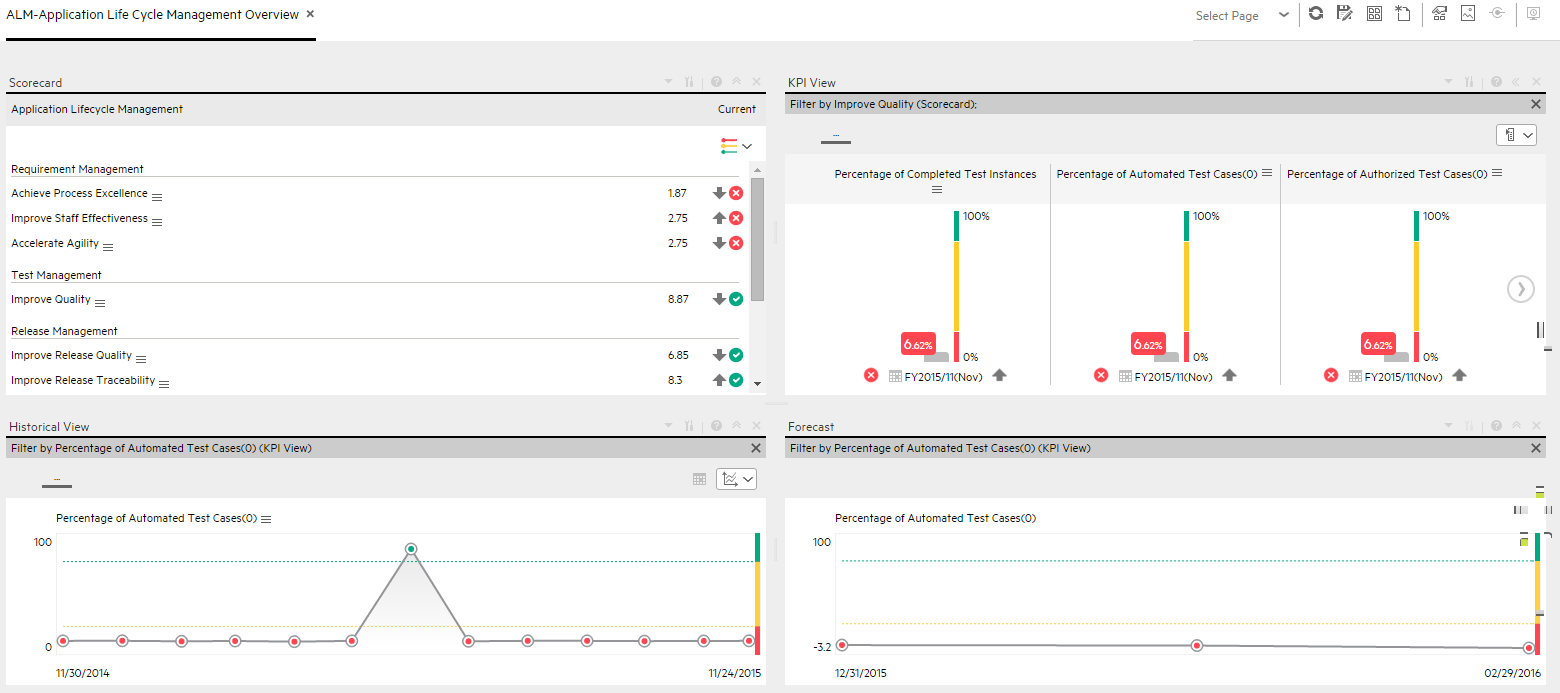
- Dan is the RnD Director responsible for multiple applications within the IT department. He has a weekly meeting with his team in order to discuss the performance and expectations of the applications that his organization implements. Before the meeting, he logs on to the IT Business Analytics (ITBA) application.
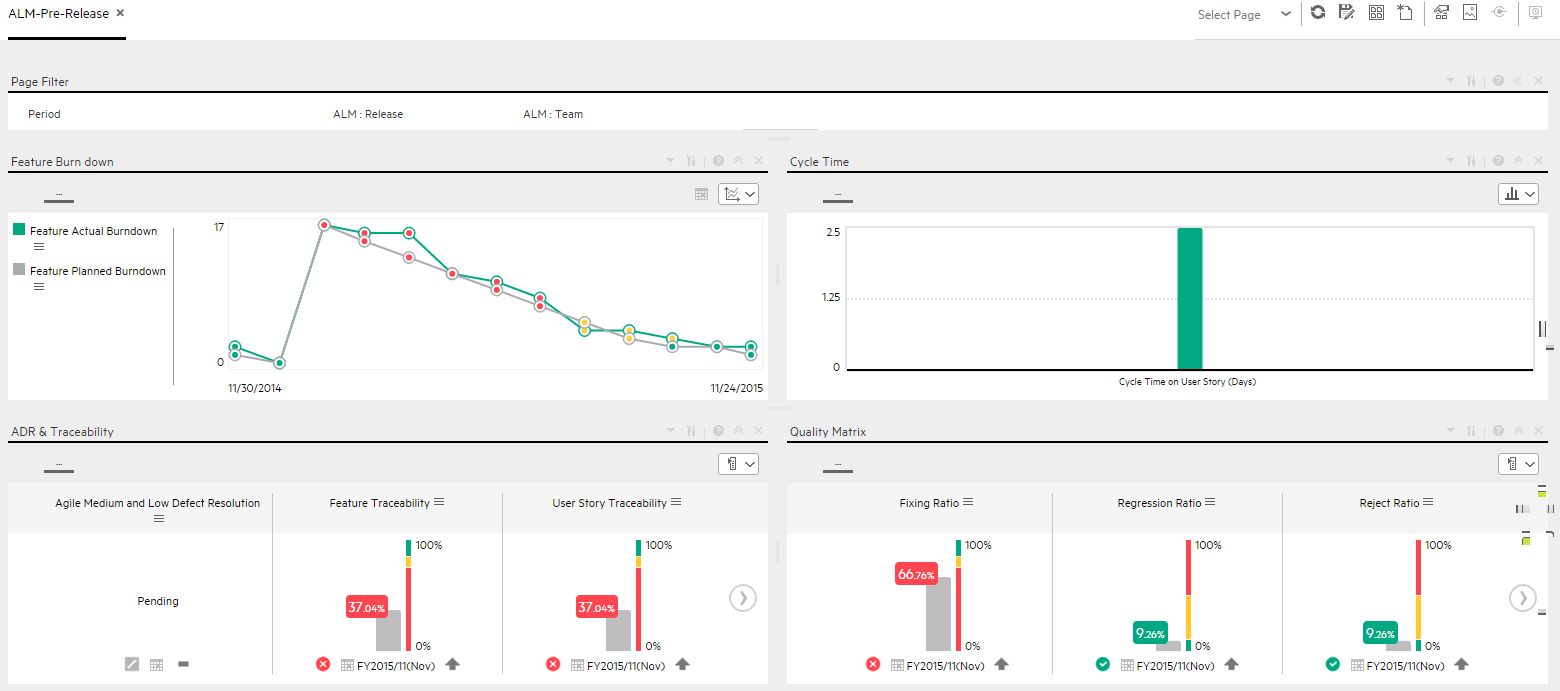
- Dan launches the ALM-Pre Release page to view the latest updates of the overall release performance.
- He starts looking at the KPIs in the Quality matrix section, and notices that the Fixing Ratio KPI value is very low and does not meet the normal thresholds. Its status is Red. Other Quality KPI values are in the normal range.
-
Dan changes the KPI view to display the trend view in order to view the historical trend of the KPI in the component below.
- He notices that some times in the last few months, the KPI value showed a bad ratio.
-
To understand if there is a specific period in the month that affects the overall ratio, Dan drills down by changing the periodicity to weekly.
-
He finds out that the ratio is overall good, however, at the end and beginning of each month the ratio drops for unknown reasons.
- Dan wishes to continue his analysis to understand which team is responsible for this situation.
-
He changes the visualization back to Bars and selects the Fixing Ratio KPI and clicks the breakdown by ALM Release in order to understand which release project may cause the KPI result.
-
He realizes that the Hercules release worsened dramatically and caused the value of the KPI to increase.
- He writes an annotation to Peter, the PMO who manage this release project, requesting clarifications.
- Peter receives an email from Dan regarding the problematic KPI. He logs on to the ITBA application, checks the same KPI, and sees that the ratio is low.
- Peter checks the future behavior of the KPI (forecast) and understands that something needs to be done to overcome this issue.
- He sets a brainstorm meeting with his team to understand why the Fixing Ratio decreases at the beginning and at the end of each month and asks the team to come up with reasons why and with a plan.
- The team finds out that for the past few months, the more experienced engineers attended training workshops at the beginning and at the end of each month, which left the new and not so experienced engineers to deal with defects. This caused a low quality delivery and a low Fixing Ratio.
 ALM_Demo and ALM
User interface elements are described below (when relevant, unlabeled elements are shown in angle brackets):
|
UI Element |
Description |
|---|---|
| Pages | |
| Scorecards |
|
| Business Contexts |
For details, see Semantic Layer - Contexts and Universes. |
| KPIs and Metrics |
Note The Demo CAP includes KPIs with names followed by (Demo). The CAP includes the same KPIs with names that do not include (Demo). The KPIs are the same but have different names so that both the Demo CAP and the CAP can be activated at the same time.
|
| Data (External Tables) |
ALM_Demo |
ALM-Application LifeCycle Management Overview Page
ALM-Pre-Release Page
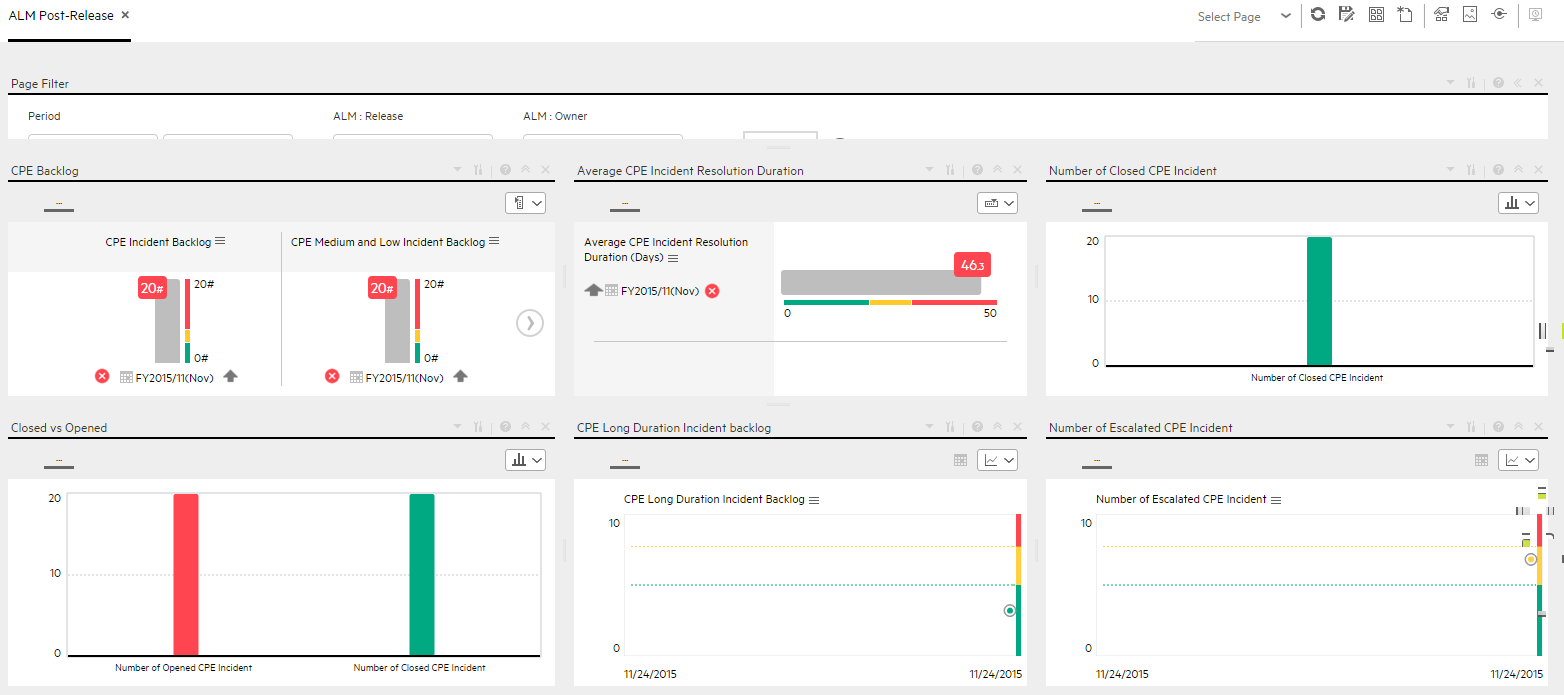
ALM-Post-Release Page
We welcome your comments!
To open the configured email client on this computer, open an email window.
Otherwise, copy the information below to a web mail client, and send this email to SW-Doc@hpe.com.
Help Topic ID:
Product:
Topic Title:
Feedback: