
Searching the Help
To search for information in the Help, type a word or phrase in the Search box. When you enter a group of words, OR is inferred. You can use Boolean operators to refine your search.
Results returned are case insensitive. However, results ranking takes case into account and assigns higher scores to case matches. Therefore, a search for "cats" followed by a search for "Cats" would return the same number of Help topics, but the order in which the topics are listed would be different.
| Search for | Example | Results |
|---|---|---|
| A single word | cat
|
Topics that contain the word "cat". You will also find its grammatical variations, such as "cats". |
|
A phrase. You can specify that the search results contain a specific phrase. |
"cat food" (quotation marks) |
Topics that contain the literal phrase "cat food" and all its grammatical variations. Without the quotation marks, the query is equivalent to specifying an OR operator, which finds topics with one of the individual words instead of the phrase. |
| Search for | Operator | Example |
|---|---|---|
|
Two or more words in the same topic |
|
|
| Either word in a topic |
|
|
| Topics that do not contain a specific word or phrase |
|
|
| Topics that contain one string and do not contain another | ^ (caret) |
cat ^ mouse
|
| A combination of search types | ( ) parentheses |
|


![]()
![]()

VP of Operations CAP
The VP of Operations Content Acceleration Pack (CAP) provides broad and deep insight that should enable you to create the enterprise infrastructure and operations strategy and aligning it to the business, to deliver IT services to the lines of business, end users, and customers at the required cost, service level, and speed, to optimize infrastructure and operations to improve productivity, efficiency, service quality, and agility, as well as to negotiate and manage all external contracts related to hardware, software, and co-location facilities.
The use case for this Content Acceleration Pack is to provide a 360 Degree Service View.
The data sources for the VP of Ops CAP are Project and Portfolio Management (PPM), and Service Manager (SM).
The relevant content packs are PPM and SM. For details, see Integration with PPM, and Integration with SM.
 VPOps_Demo
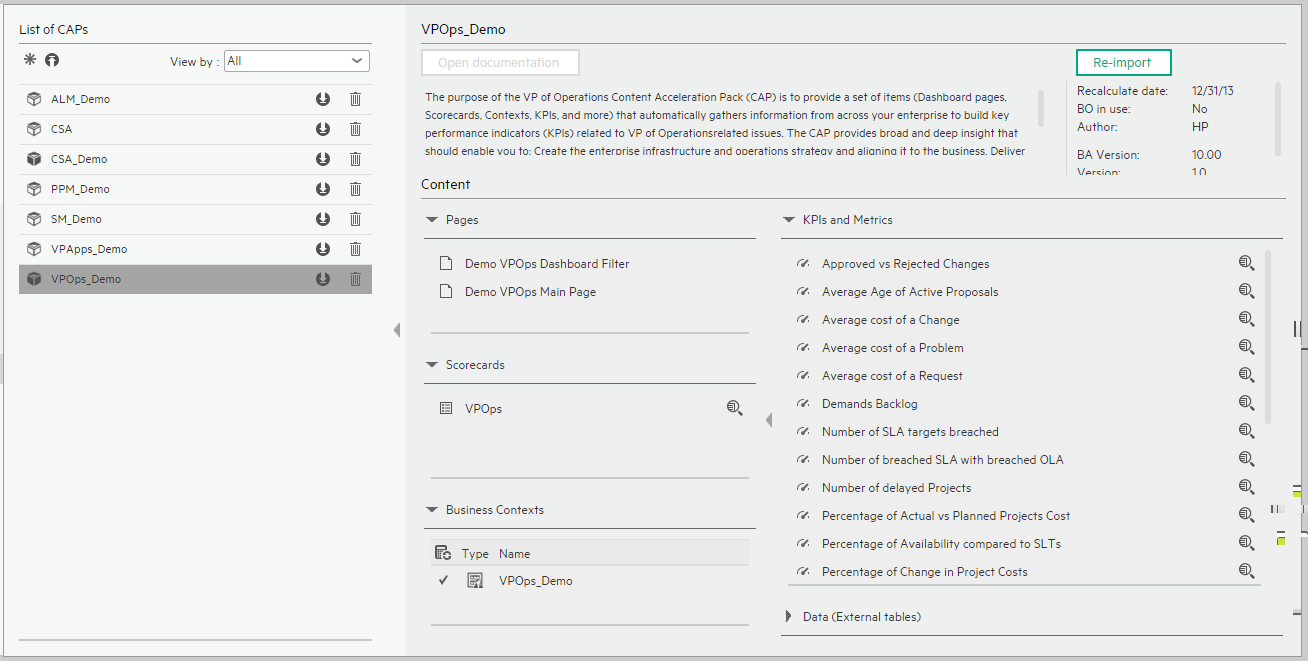
User interface elements are described below (when relevant, unlabeled elements are shown in angle brackets):
|
UI Element |
Description |
|---|---|
| Pages | |
| Scorecards |
VPOps_Demo VPOps |
| Business Contexts |
VPOps_Demo For details, see Semantic Layer - Contexts and Universes. |
| KPIs and Metrics |
Note The Demo CAP includes KPIs with names followed by (Demo). The CAP includes the same KPIs with names that do not include (Demo). The KPIs are the same but have different names so that both the Demo CAP and the CAP can be activated at the same time.
|
| Data (External Tables) |
VPOPS_demo |
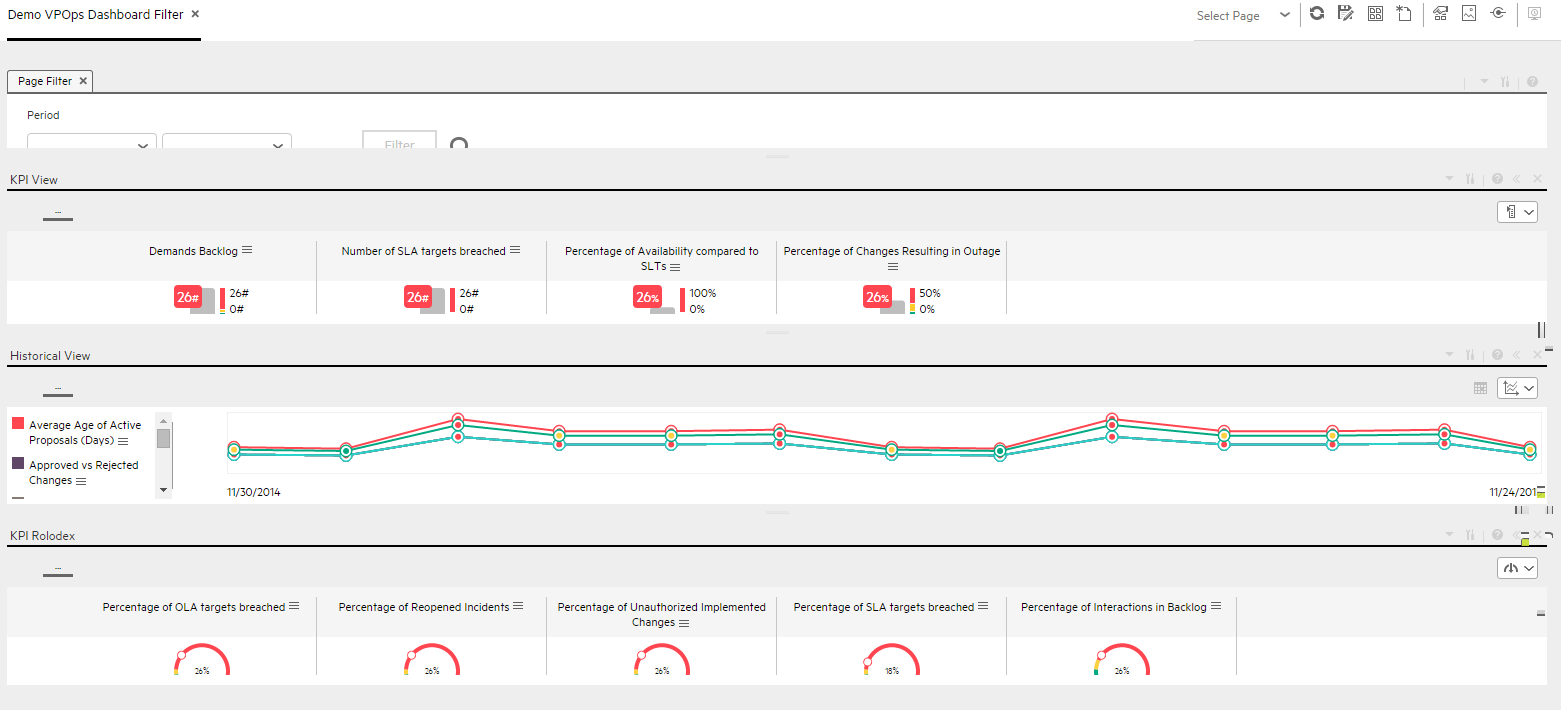
Demo VPOps Dashboard Filter Page
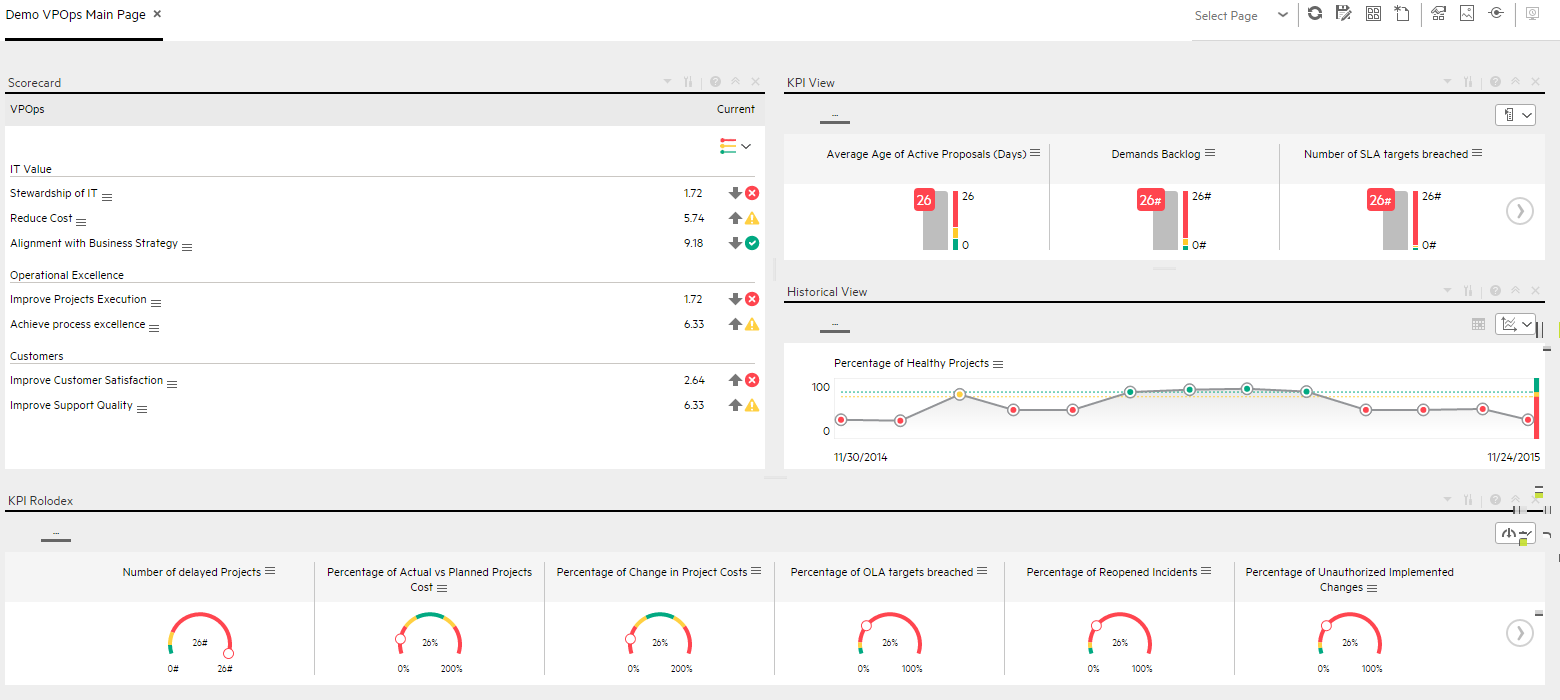
Demo VPOps Main Page
We welcome your comments!
To open the configured email client on this computer, open an email window.
Otherwise, copy the information below to a web mail client, and send this email to SW-Doc@hpe.com.
Help Topic ID:
Product:
Topic Title:
Feedback: