
Searching the Help
To search for information in the Help, type a word or phrase in the Search box. When you enter a group of words, OR is inferred. You can use Boolean operators to refine your search.
Results returned are case insensitive. However, results ranking takes case into account and assigns higher scores to case matches. Therefore, a search for "cats" followed by a search for "Cats" would return the same number of Help topics, but the order in which the topics are listed would be different.
| Search for | Example | Results |
|---|---|---|
| A single word | cat
|
Topics that contain the word "cat". You will also find its grammatical variations, such as "cats". |
|
A phrase. You can specify that the search results contain a specific phrase. |
"cat food" (quotation marks) |
Topics that contain the literal phrase "cat food" and all its grammatical variations. Without the quotation marks, the query is equivalent to specifying an OR operator, which finds topics with one of the individual words instead of the phrase. |
| Search for | Operator | Example |
|---|---|---|
|
Two or more words in the same topic |
|
|
| Either word in a topic |
|
|
| Topics that do not contain a specific word or phrase |
|
|
| Topics that contain one string and do not contain another | ^ (caret) |
cat ^ mouse
|
| A combination of search types | ( ) parentheses |
|


![]()
![]()

AM_Demo and AM CAPs
The purpose of the AM_Demo and AM Content Acceleration Packs (CAPs) is to provide a set of items (Scorecards, Contexts, KPIs, Metrics, and more) that automatically gathers information from across your enterprise to build key performance indicators (KPIs) related to AM-related issues with OOTB data from Data Warehouse as well as Dashboard pages that display the relevant information. The CAPs provide broad and deep insight that should enable you to Improve Staff Effectiveness, Improve Responsiveness, Achieve Process Excellence, Improve Quality of Delivery, and Improve Customer Satisfaction. This CAP provides a 360 degree Asset Manager view.
The AM_Demo is based on data in .csv files that are part of the CAP package and AM CAPs include data from the Asset Manager data source.
The relevant content pack is AM. For details, see Integration with AM.
 User Story
-
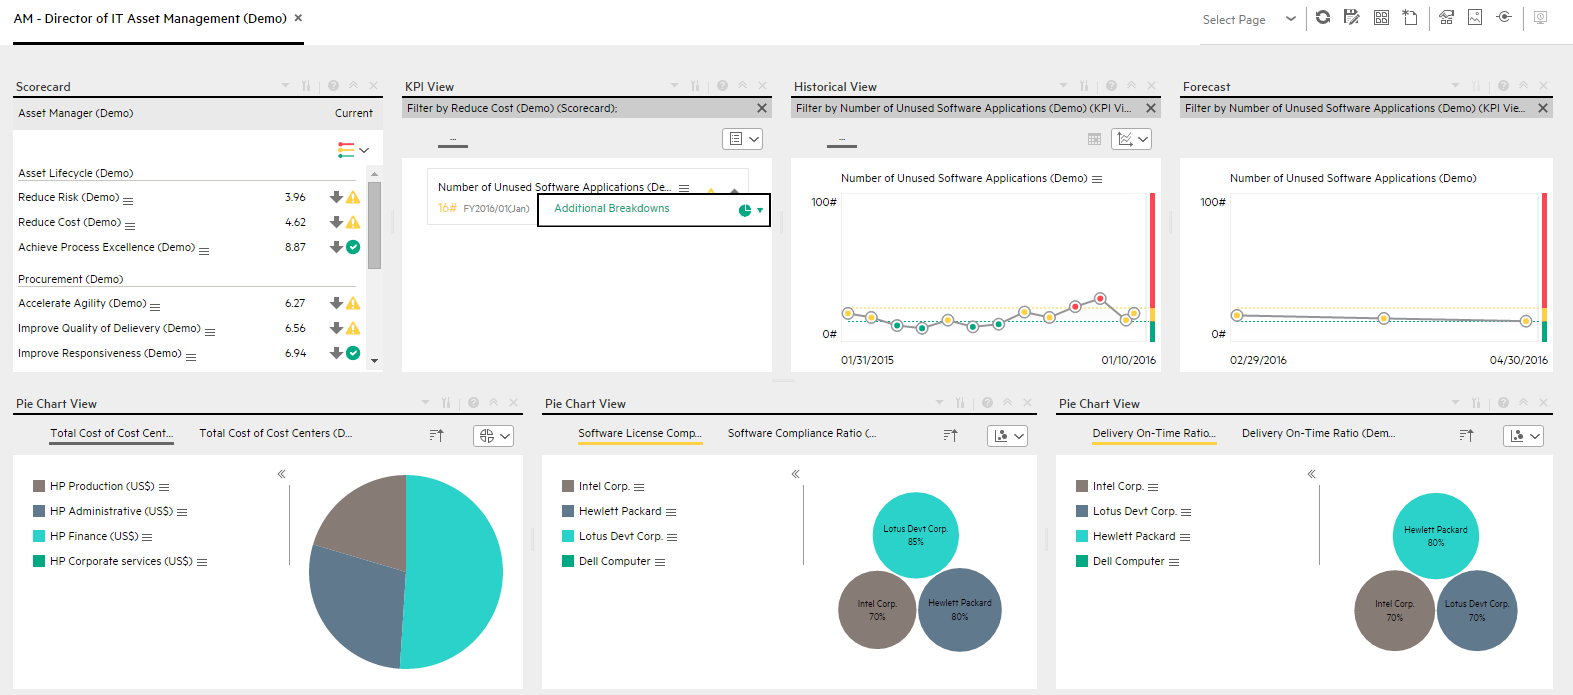
Maggie is the IT Director of Asset Management at ABC Inc. She manages the entire asset life-cycle of the IT organization.
-
One of her responsibilities is to ensure that the software licenses are compliant.
-
She logs into the AM – Director of IT Asset Management Dashboard page, and looks at her Scorecard to understand the overall performance of her organization and finds that the Increase Compliance Objective under the Software License Perspective is red.
-
She clicks the Objective and finds that the cause is the Software Compliance Ratio KPI that is also red.
-
Meanwhile, the Historical View shows, for the Software License Compliance KPI , a negative weekly trend for the last two weeks. Based on the current results, the Forecast component also shows a continuously decline for the week after and in the future.
-
Drilling down further, Maggie then looks at the KPI Breakdown called Software License Compliance Ratio Breakdown by Supplier in the Pie Chart View and realizes that the Dell Computer supplier only meets less than 45 percent of the license compliance ratio and is the cause of the red ratio of the KPI. She then clicks on the Dell Computer legend to open the KPI EXPLORER, where the data shows details about the software count for which licenses are not compliant.
-
Maggie sends an annotation to Richard, the Supplier Manager, requesting clarifications:"Richard – We have poor Software License Compliance performance on “Apache Group” supplier, please provide insight and set a plan by EOW".
-
Richard is responsible for maintaining the license contracts with the Apache Group supplier. When he gets the annotation from Maggie he checks his Scorecard and starts the analysis of the problem.
-
Richard then replies to Maggie that he will initiate a meeting with the supplier to discuss the license contract.
AM_Demo and AM
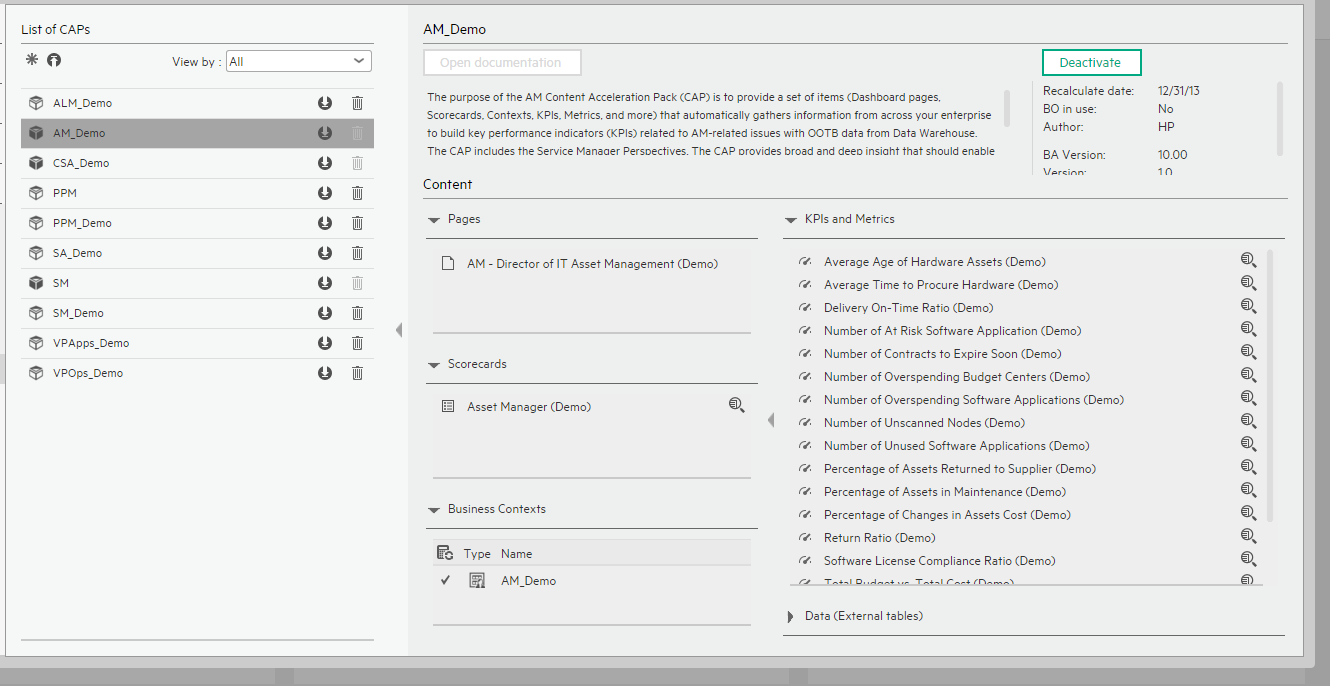
User interface elements are described below (when relevant, unlabeled elements are shown in angle brackets):
|
UI Element |
Description |
|---|---|
| Pages | |
| Scorecards |
|
| Business Contexts |
For details, see Semantic Layer - Contexts and Universes. |
| KPIs and Metrics |
Note The Demo CAP includes KPIs with names followed by (Demo). The CAP includes the same KPIs with names that do not include (Demo). The KPIs are the same but have different names so that both the Demo CAP and the CAP can be activated at the same time.
|
| Data (External Tables) |
AM_demo |
AM - Director of IT Asset Management Page
We welcome your comments!
To open the configured email client on this computer, open an email window.
Otherwise, copy the information below to a web mail client, and send this email to SW-Doc@hpe.com.
Help Topic ID:
Product:
Topic Title:
Feedback: