


Software Utilization Report
This report displays all the installed software on the current machine with utilization data.
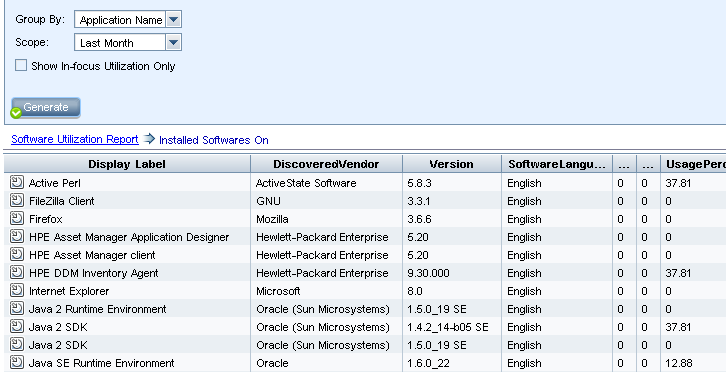
| Report Example |
|
| To access |
Select Managers > Modeling > Reports. In the Custom Reports pane, do one of the following:
|
| Important information |
The top level of the report displays the number of installed applications for each software type. You can drill down to view utilization data on specific software applications. Use the Select Columns When the report is grouped by Related Node, a column called Installed Software is available, which displays the number of installed applications on that node. It also provides a clickable link to drill down and display the applications' details. Applications with no utilization data do not appear in the report. |
| Relevant tasks | How to Generate a Custom Report |
 button
and select Software Utilization Report.
button
and select Software Utilization Report. button to select the attributes to display in the report. When the report is grouped by Application Name or Vendor Name, a column called Installed On is available at the level of installed applications (after drilling down). The column displays the location where the software is installed and provides a clickable link to the node.
User interface elements are described below (unlabeled elements are shown in angle brackets):
| UI Element (A-Z) | Description |
|---|---|
| <Breadcrumbs> |
Displays the levels through which you have navigated to get to the current level. Appears horizontally across the top of the chart. Note Each level in the list of breadcrumbs is a clickable link. |
| <Shortcut Menu> | Right-click a CI in the report to access the IT Universe Manager shortcut menu. For details, see IT Universe Manager Shortcut Menu. |
| <Toolbar> | For details, see Report Toolbar Options. |
| Group By |
Select the method for displaying the data. The available options are:
|
| Scope |
Select the scope of the report. The available options are:
|
| Show In-focus Utilization Only |
Select this check box to configure the report to display only the utilization data for the time that an application was in focus (when it was in the foreground). When the check box is cleared, the report displays utilization data for the time that an application was running (even when it was in the background). |