
Searching the Help
To search for information in the Help, type a word or phrase in the Search box. When you enter a group of words, OR is inferred. You can use Boolean operators to refine your search.
Results returned are case insensitive. However, results ranking takes case into account and assigns higher scores to case matches. Therefore, a search for "cats" followed by a search for "Cats" would return the same number of Help topics, but the order in which the topics are listed would be different.
| Search for | Example | Results |
|---|---|---|
| A single word | cat
|
Topics that contain the word "cat". You will also find its grammatical variations, such as "cats". |
|
A phrase. You can specify that the search results contain a specific phrase. |
"cat food" (quotation marks) |
Topics that contain the literal phrase "cat food" and all its grammatical variations. Without the quotation marks, the query is equivalent to specifying an OR operator, which finds topics with one of the individual words instead of the phrase. |
| Search for | Operator | Example |
|---|---|---|
|
Two or more words in the same topic |
|
|
| Either word in a topic |
|
|
| Topics that do not contain a specific word or phrase |
|
|
| Topics that contain one string and do not contain another | ^ (caret) |
cat ^ mouse
|
| A combination of search types | ( ) parentheses |
|


![]()
![]()

- Out-of-the-Box Content Packs (CPs)
Integration with CSA
The purpose of the integration of CSA as a data source is to bring this information into the Data Warehouse.
This section describes the integration, contexts, KPIs, Metrics, and reports, if any, associated with the integration with specific data sources.
For details about Cloud Service Automation (CSA), see http://www8.hp.com/us/en/software-solutions/cloud-service-automation/index.html.
Select ADMIN> Data Management > Connect Data Source then click Add data source and select CSA to activate the integration processes for the CSA data source.
 Other Data Sources
The data from the below data sources is integrated with the data from CSA and displayed in the CSA CAP pages, KPIs, and Metrics. For details, see CSA_Demo and CSA CAPs .
-
Amazon Web Services (AWS) is a secure cloud services platform, offering compute power, database storage, content delivery and other functionality to help businesses scale and grow.
-
Amazon CloudWatch (AWSCW) monitors your Amazon Web Services resources and the applications you run on AWS in real-time. You can use CloudWatch to collect and track metrics, which are the variables you want to measure for your resources and applications. CloudWatch alarms send notifications or automatically make changes to the resources you are monitoring based on rules that you define. For example, you can monitor the CPU usage and disk reads and writes of your Amazon Elastic Compute Cloud (Amazon EC2) instances and then use this data to determine whether you should launch additional instances to handle increased load. You can also use this data to stop under-used instances to save money. In addition to monitoring the built-in metrics that come with AWS, you can monitor your own custom metrics. With CloudWatch, you gain system-wide visibility into resource utilization, application performance, and operational health.
-
Azure is Microsoft cloud computing platform, a growing collection of integrated services like analytics, computing, database, mobile, networking, storage, and web, for moving faster, achieving more, and saving money.
-
Virtual Performance Viewer (vPV) is a web-based analysis and visualization tool that analyzes performance trends of elements in virtualized environments. vPV gives you at-a-glance visibility across your virtual environment for real-time insights into performance, capacity, and health. This helps you to optimize your infrastructure and quickly solve virtualization and cloud performance issues. It enables virtualization monitoring by providing an overview of the environment, near-real-time and historical data analysis and triaging using an interactive dashboard. It also enables monitoring for cloud and hypervisor environments. HPE vPV provides performance monitoring, graphing, and reporting in a single interface.
-
Cloud Optimizer (CO) is a web-based analysis and visualization tool that analyzes performance trends of elements in virtualized environments. CO gives you at-a-glance visibility across your virtual environment for real-time insights into performance, capacity, and health. This helps you to optimize your infrastructure and quickly solve virtualization and cloud performance issues. It enables virtualization monitoring by providing an overview of the environment, near-real-time and historical data analysis and triaging using an interactive dashboard. It also enables monitoring for cloud and hypervisor environments. CO provides performance monitoring, graphing, and reporting in a single interface.
-
Server Automation (SA) enables you to govern the full spectrum of your software management requirements. With SA policy-based software management you can automate software installation and application configuration, and ensure that managed servers are compliant with software policies.
Important Information
- If you use the integration with CSA, you must install SAP® Business Objects to display the relevant data in the Webi reports.
- To learn about Content Packs and their functionality, see Data Management - Connect the Data Sources .
-
The CSA Content Pack supports multiple instances.
-
All fields are case-sensitive.
- The CSA ETL job aggregates the CSA Subscription Price with a daily granularity in the target database. This means that the ETL job gets the price from CSA, converts it into the actual cost according to the ETL running date, generates a cost record for that day, and stores it in the target database. For example, if the current date is April 22nd, for the month of April, after the ETL run has completed, you see a total of the 22 aggregated records of the CSA subscription Price in the target database.
-
Example of a CSA subscription price calculation: If, for example, the price of one daily subscription is $10, you have just used the subscription for 12 hours, and the ETL starts to run at this moment, the total you have to pay is 10*12/24=$5. The CSA subscription price is calculated for the real usage accurate to the second. Though some customers would prefer to see $10 on the report even if the usage is not yet 24 hours, BA displays $5 after the ETL load because it represents the real usage.
-
DCS Integration: An extractor using the Data Collection Service mechanism that extracts entities from the source and generates corresponding flat files. For details, see Data Collection Service (DCS) .
-
Tip If you integrate with both CSA and AWS
- The CSA and CSA_Demo CAPs are associated with the CSA data source, its context, KPIs, and Metrics. For details, see the CSA_Demo and CSA CAPs .
-
When using CSA with Azure Content Pack version: 14.12, and the OOTB design : CSL_BP_MICROSOFT_AZURE_COMPUTE_3.20_CP3.0, Azure usage related data is displayed in the CSA-Resource Usage and Utilization for Consumer and CSA_Resource Usage and Utilization for Resource Supplier Manager reports, but Azure CPU utilization data is not available and is not displayed in these reports.

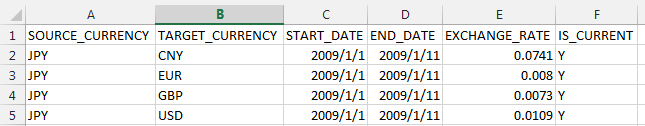
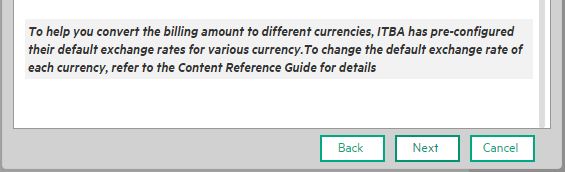
Change the default exchange rate of each currency
To help you convert the billing amount to different currencies, ITBA has pre-configured their default exchange rates.
If you want to change the default exchange rate of each currency, open the $HPBA_HOME/ContentPacks/CSA/EXTERNAL/EXCHANGE.csv file and change the rates.
Install the Content Pack
- Log on to the BA application.
-
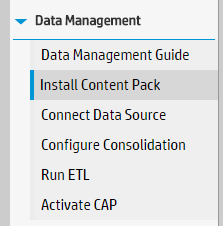
Click ADMIN > Data Management, click Install Content Pack to install the CSA Content Pack. For details, see Data Management - Install Content Pack.
Activate the CSA data source
- Log on to the BA application.
- Make sure you have installed the Content Pack (see above).
-
Click ADMIN > Data Management and the click Connect Data Source .
-
Click Add data source.
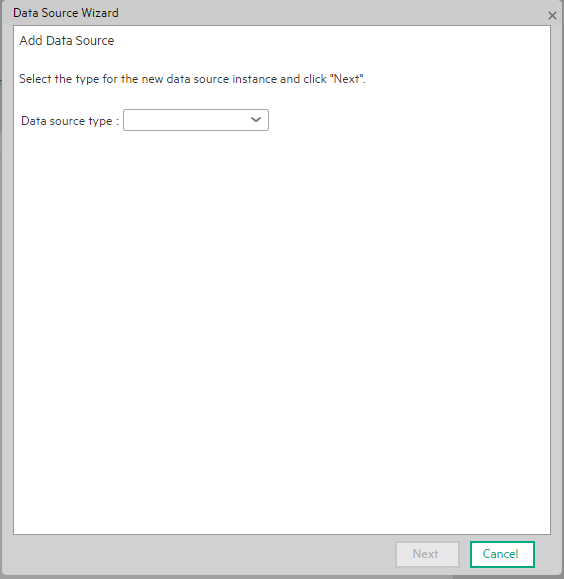
-
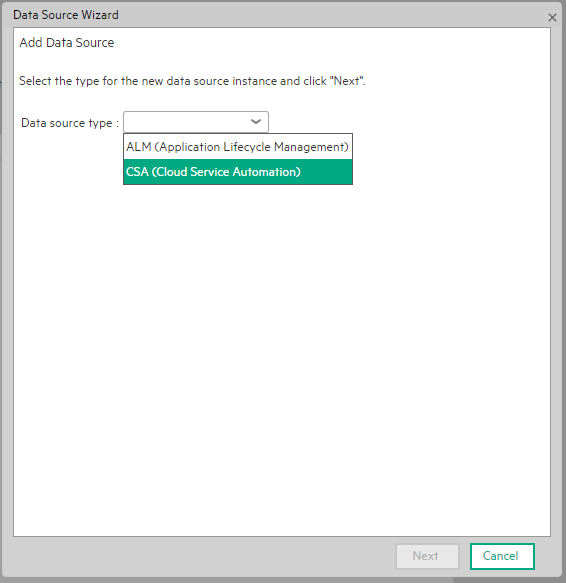
Select the CSA data source type and press Next.
If the Next button does not appear in the Wizard dialog box, click the edge of the Data Source Wizard and when the black cross appear, move the window upwards until you see the Next button.
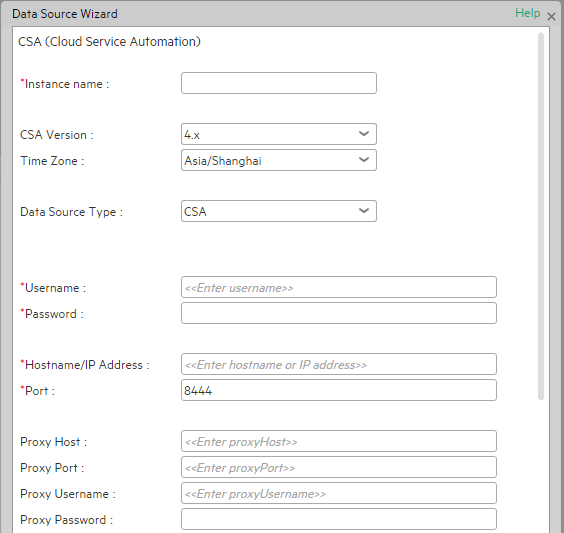
User interface elements are described below:
Note If the CSA configuration is for a named instance connection, make sure to enter the named instance port.
UI Element
Description
Instance name Enter a name for the data source instance you are activating. CSA Version Select the relevant version. . For details, see the ..
Time Zone Select the time zone for the data source. Data Source Type CSA
This parameter is read only.
Username Enter your admin username used to log on to CSA. The default username is admin. Password Enter your admin password used to log on to CSA. The default admin password is cloud. Hostname/IP Address Enter the CSA server hostname or IP address.
Port Port for REST API (default value is 8444). Initial Load Period (months) Select the number of months from which you want the initial data loaded. -
Enter the CSA configuration parameters and click Next to validate the parameters.
Execute the ETL process
After adding the CSA data source, you need to run the ETL to pull data from CSA source.
You can schedule the running of the ETL process. For details, see Data Management - Run ETL - Content Flow Management.
- Log on to the BA application.
- Make sure you have installed the Content Pack (see above).
- Make sure you have activated the data source (see above).
- Click ADMIN > Data Management > Run ETL.
-
Click Add Scheduler to schedule the ETL run or click >. This loads the data from the CSA data source.
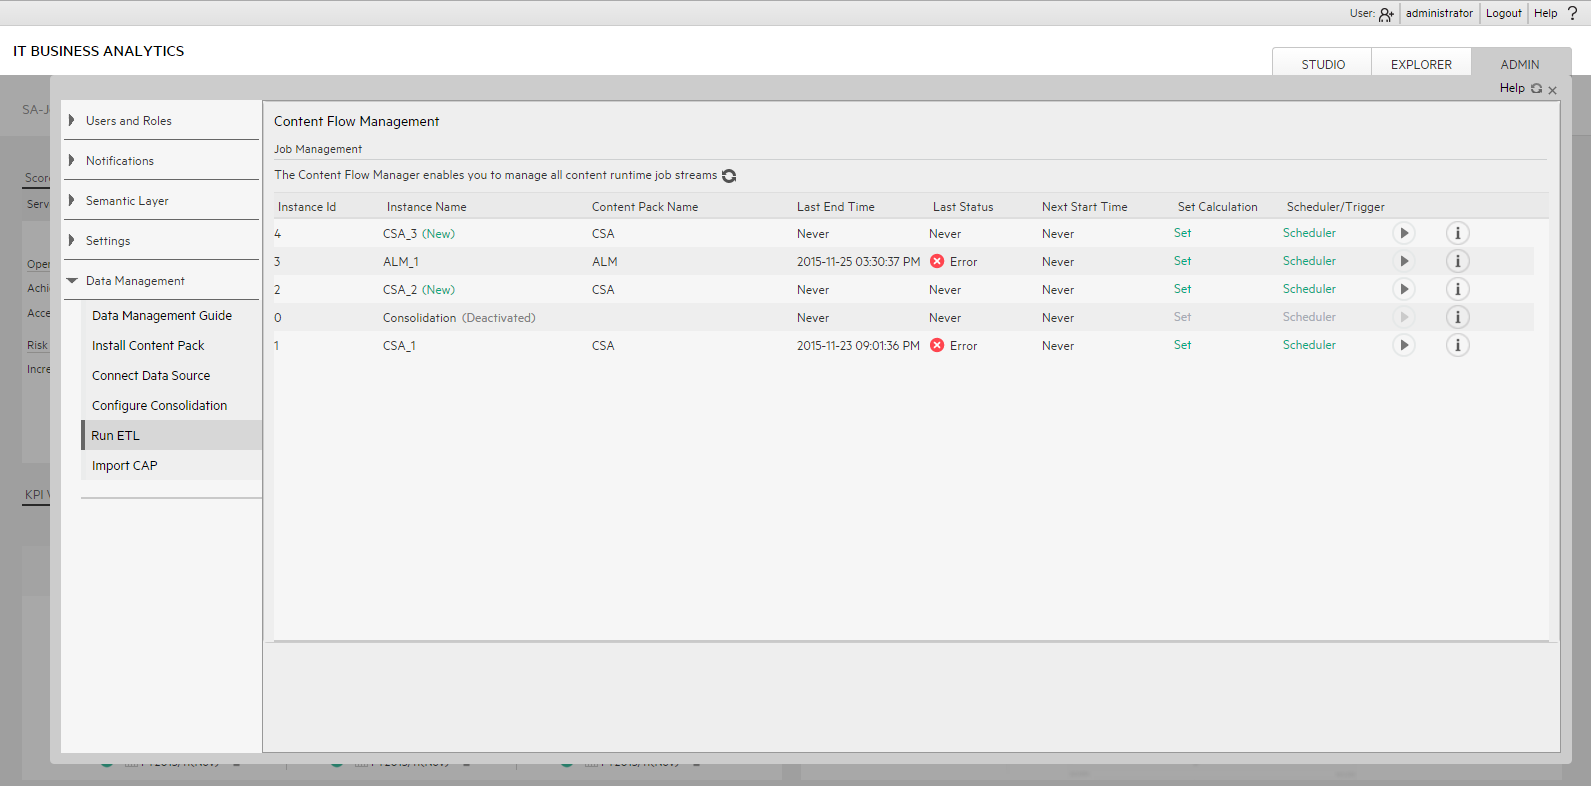
Note The ETL run might last some time depending on the volume of data it has to load.
Activate the relevant CSA CAP
Activate the CSA_Demo CAP for demo purposes or activate the CSA CAP for live data into BA.
- Log on to the BA application.
-
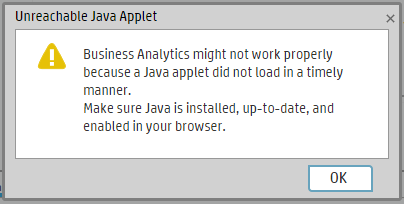
Ignore the Unreachable Java Applet. Click OK.
- Log on to the BA application.
- Make sure you have installed the Content Pack (see above).
- If you plan to activate the CSA_Demo proceed to the next step. If you plan to activate the CSA, make sure you have executed the ETL (see Execute the ETL process).
-
Click ADMIN > Data Management and click Activate CAP.
- Select the CSA or the CSA_Demo in the list of CPs, and click Activate to activate the CAP. Click Yes to begin the activation process.
Then wait until the CAP activation is successful. - Close the ADMIN tab.
Calculate the KPI
-
Log on to the BA application.
-
Click the STUDIO tab and click the calculation tool and select Recalculate.
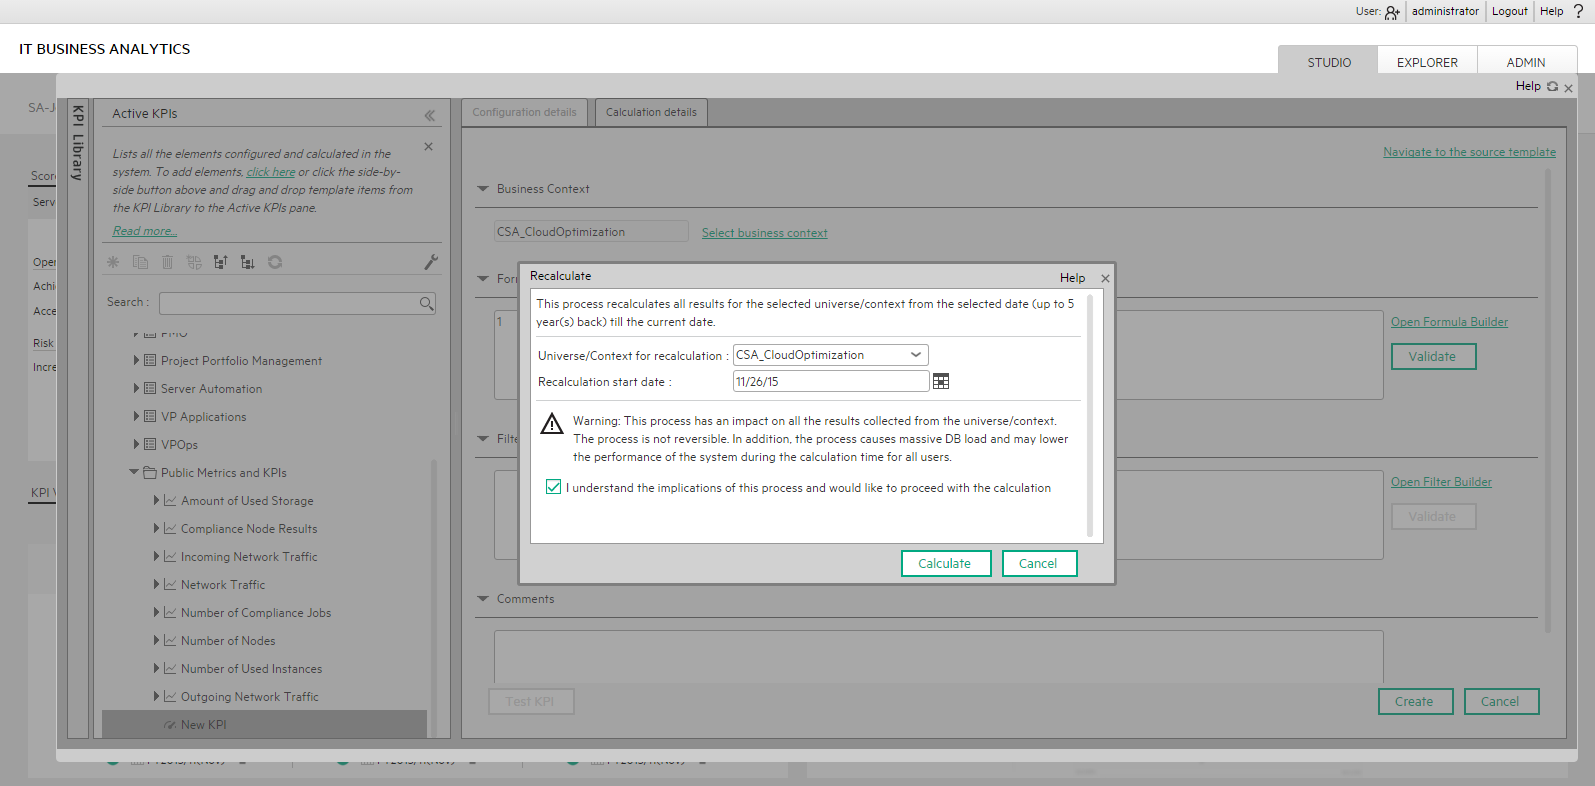
- Select the CSA_CloudOptimization in the Universe/Context for recalculation list.
- Select the recalculation start date.
- Check the check box.
-
Click Calculate.
The calculation may take a few minutes.
-
To check the KPI calculation status, click the calculation tool and select Calculation monitoring.
-
Select Calculations running now in the Monitoring options.
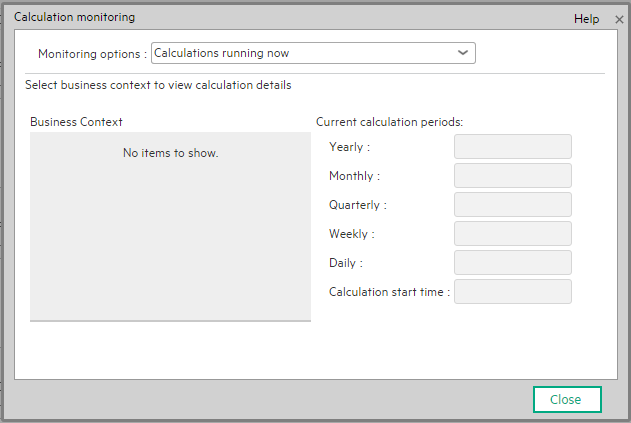
If No items to show is displayed, the KPI calculation is finished.
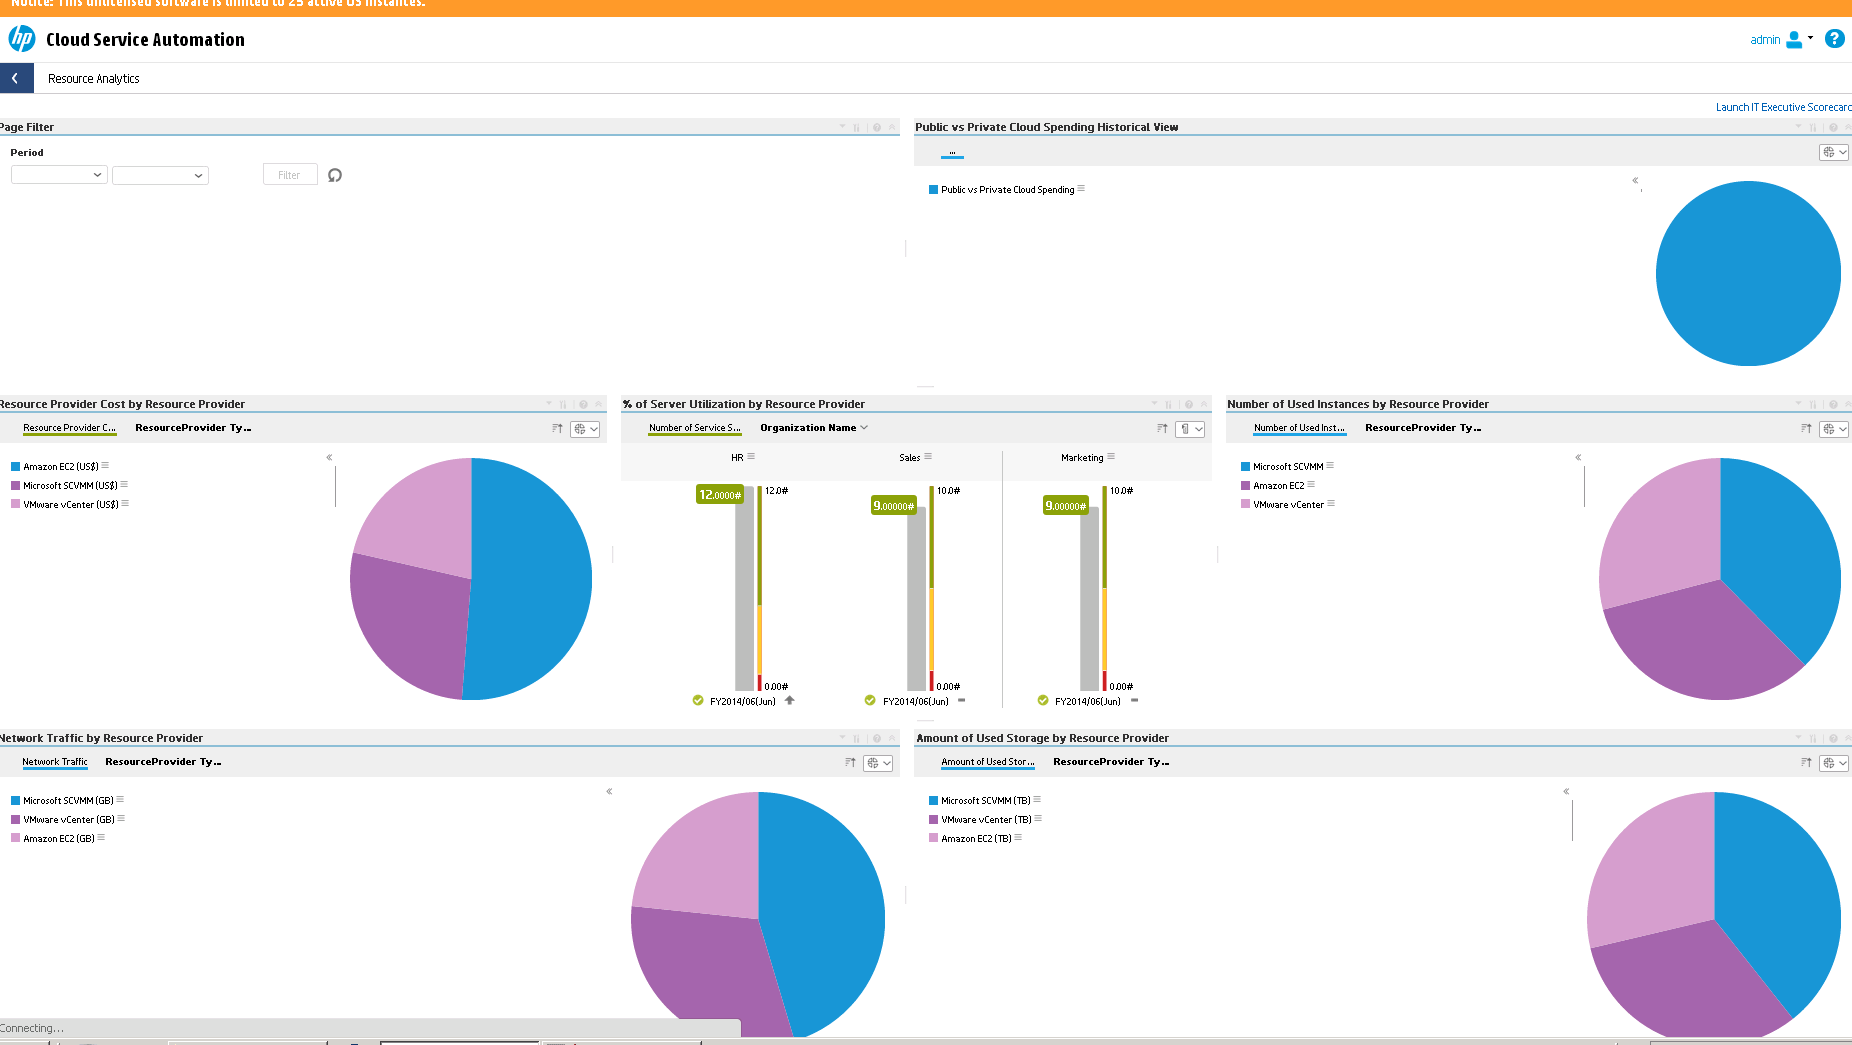
Now you can view the CSA dashboard pages with live data.
You can schedule the Scheduled calculation of the KPI. For details, see Calculation Scheduling .
Configure the Cloud Analytic Tiles in the Provider Portal
-
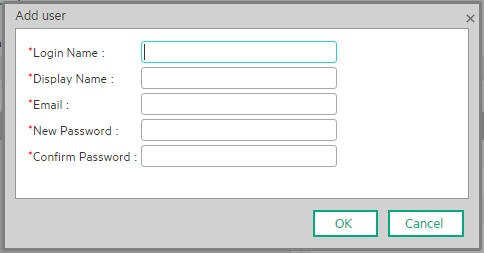
Create a user in ITBA with the same login name as in CSA.
-
From the ITBA ADMIN tab, create an ITBA user account with same login name as CSA (admin). The password does not need to be the same. The password needs to be complex.
- Log out from ITBA, and log on again in as the administrator.
- Select the pages relevant to CSA and make sure you can see the pages with live data.
-
-
Configure single sign-on:
-
Enable SSO between the CSA Cloud Service Management Console (SMC) and BA. For details, see "Enabling the Cloud Analytics Secondary Tiles" in the HP Cloud Service Automation Configuration Guide.
Enable SSO between the Marketplace Portal (MPP) and BA. For details, see "Configure the Showback Report Tile" in the HP Cloud Service Automation Configuration Guide.
-
In CSA, initString is configured in the crypto element in the
%CSA_HOME%\jboss-as-7.1.1.Final\standalone\deployments\csa.war\WEB-INF\hpssoConfiguration.xml file.The initString value represents a secret key and should be treated as such in your environment.
Navigate to the <crypto> tag and enter the relevant value in the initString parameter.
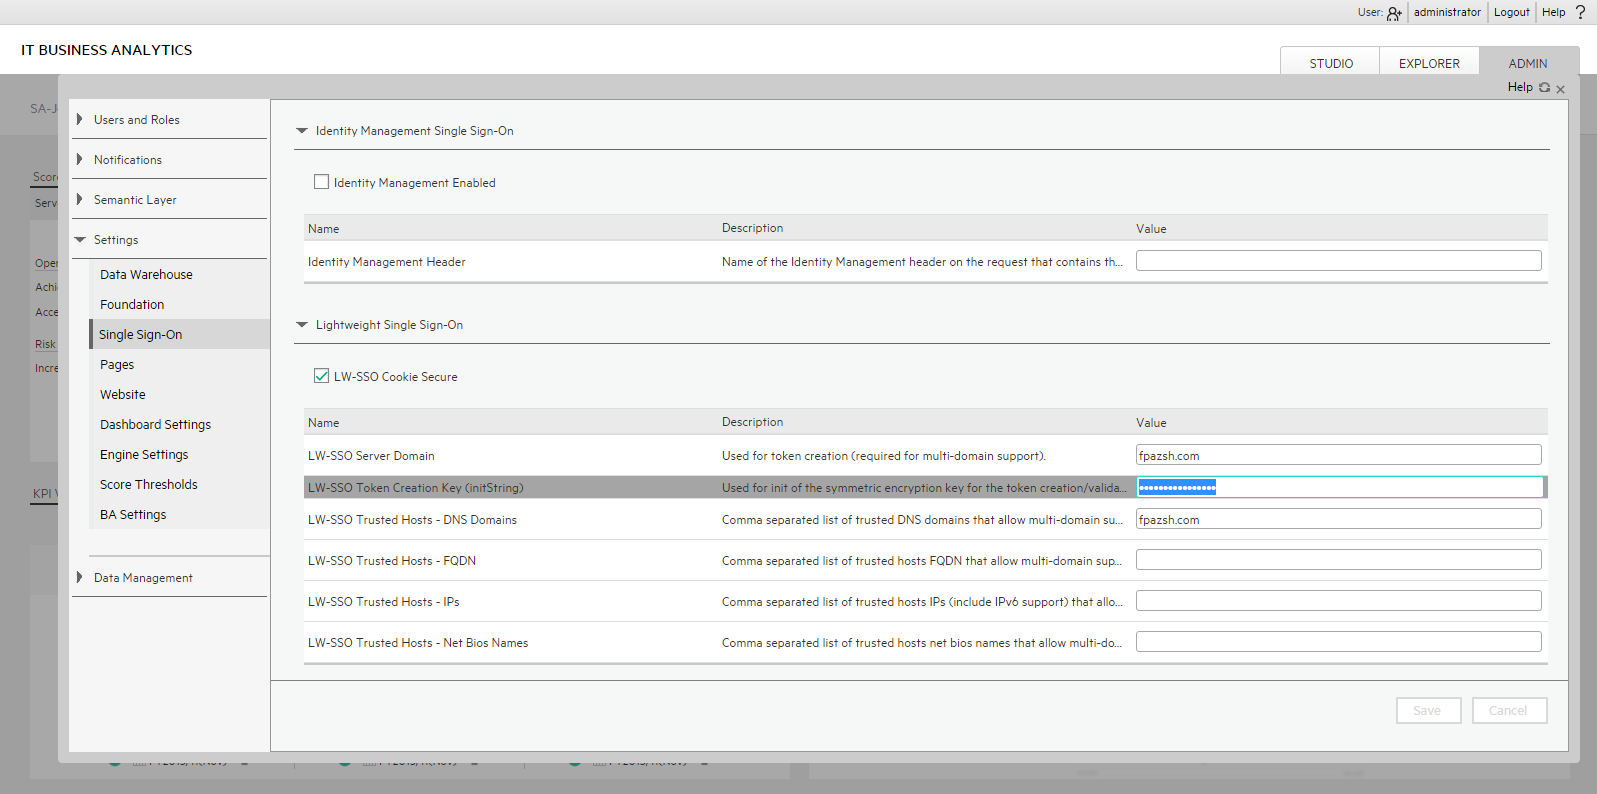
-
In BA, click ADMIN > Settings > Single Sign-on and set the LW-SSO Token Creation key (initString) with the key above (without the double-quote and without the string “initString”). Change the domain name to the BA server domain (CSA server should have the same domain name). Click Save.
-
-
Configure the embedded page URL:
- In CSA server, backup the %CSA_HOME%/jboss-as-7.1.1.Final/standalone/deployments/csa.war/dashboard/config.json file (where %CSA_HOME% is the directory in which Cloud Service Automation is installed).
- Edit the config.json file.
-
Search for the id: executive_scorecard tile (beware there are two such tiles), start from the second (type = secondary) as shown below:
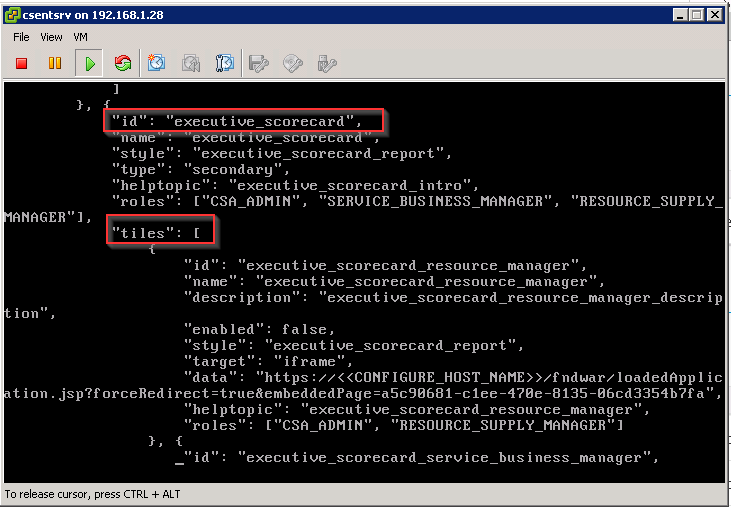
-
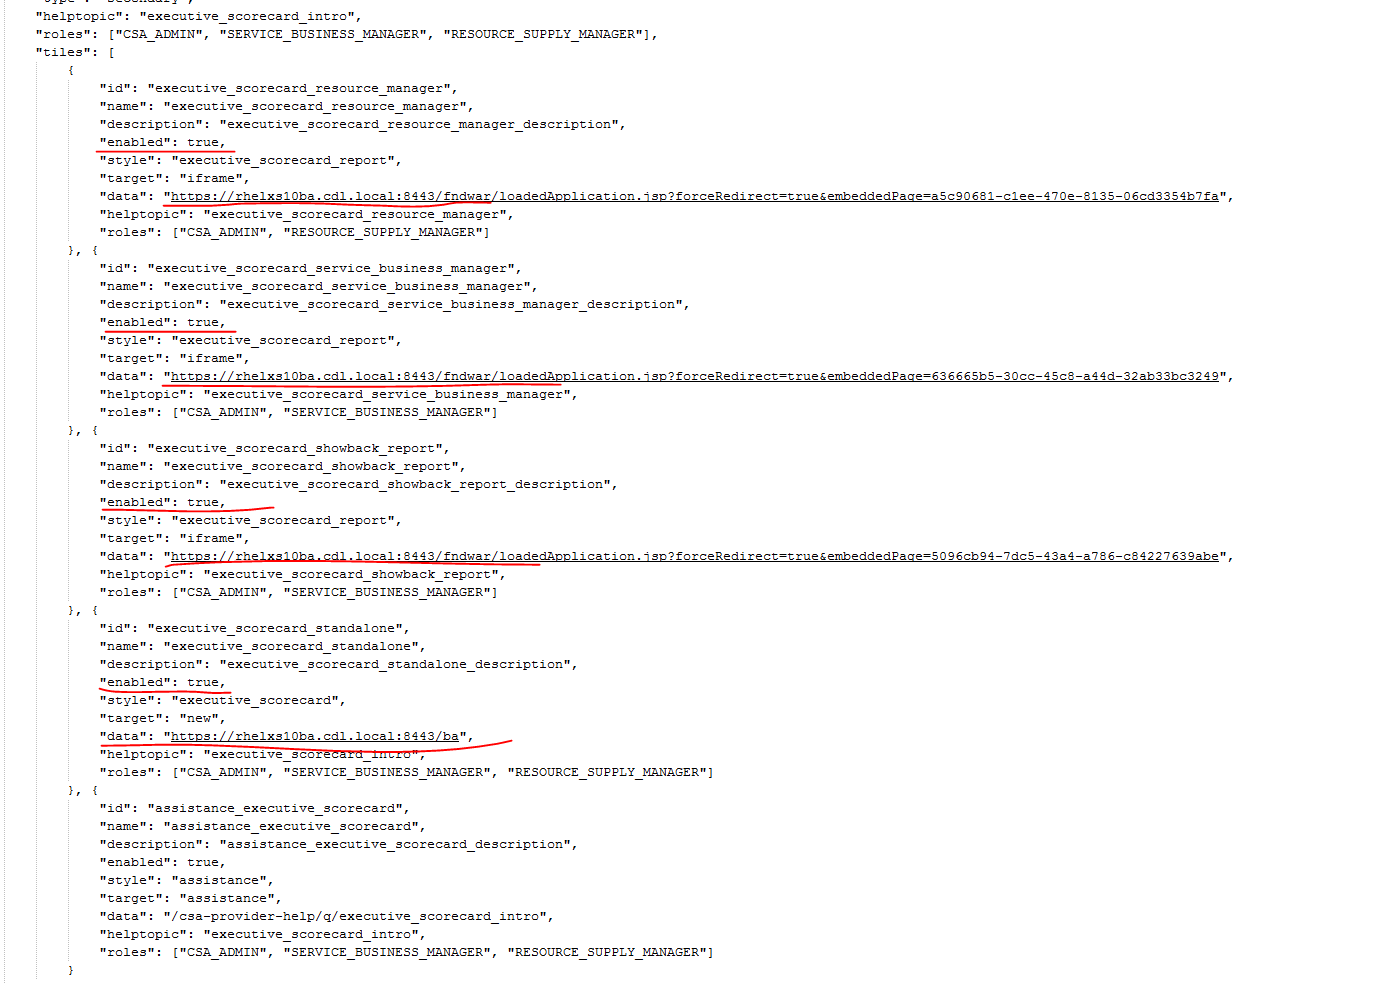
Under the tiles node, change “enabled”: false to “enabled”: true, for the following ids:
- Executive_scorecard_resource_manager
- Executive_scorecard_service_business_manager
- Executive_scorecard_showback_report
- Do not change it in the id: executive_scorecard_standalone.
- Change “enabled”: true to “enabled”: falsein the id: assistance_executive_scorecard.
-
For all tiles that are under the id: executive_scorecard, in the data section, change <CONFIGURE_HOST_NAME> to match the hostname of your Business Analytics installation. For example xs.example.com.
-
Access BA pages in the CSA system:
-
Log on to CSA using the full qualifier domain name (FQDN) URL.
-
Open the embedded BA pages in the CSA system.
-
Support CSA Multiple Currency for Service Offering
-
Edit EXCHANGE.csv.
-
Upload EXCHANGE.csv to $HPBA_Home/ContentPacks/CSA/EXTERNAL in the BA server.
- Run the ETL to import exchange data. For details, see Data Management - Run ETL - Content Flow Management.
Configure the Showback report for the Consumer Organization Administrator
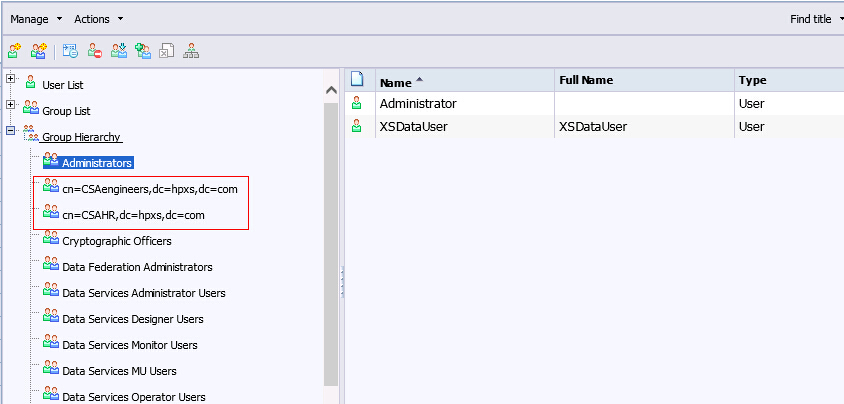
In this section, we simulate the CSA Consumer Organization administrator use case that leverages two existing groups in the LDAP server. Each group can only see its own group's data. CSAEngineers group can only see the engineering group data and the CSAHR group can only see the HR group data. For details, see also Setting access restrictions on a universe in the Universe Designer for BusinessObjects XI 3.1.
Step 1 - Configure resource, user and permission
-
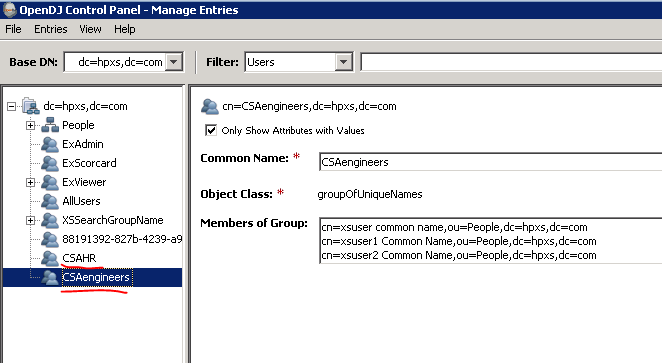
In the CSA integrated LDAP server, select 2 groups: CSAHR and CSAEngineers.
-
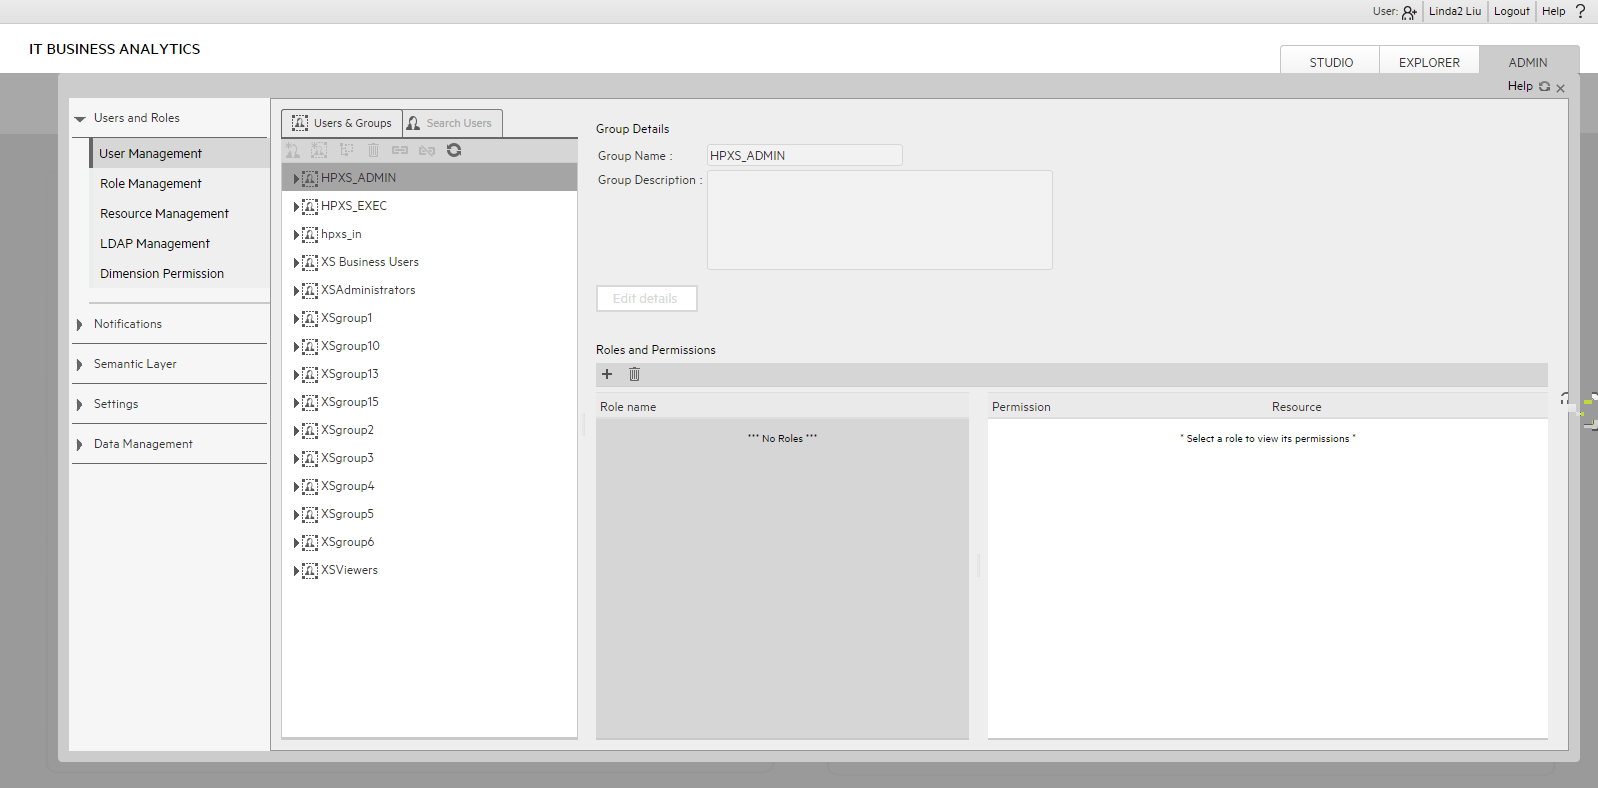
In the ITBA application, configure LDAP. For details, see Users and Roles - LDAP Management.

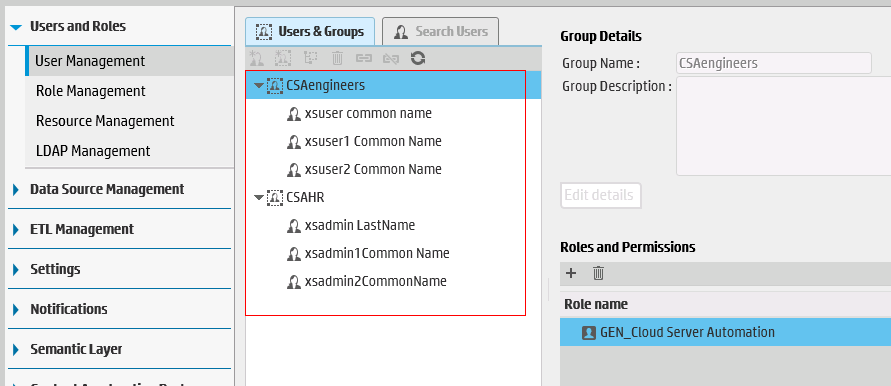
Create the CSAengineers and CSAHR groups and assign them users.
-
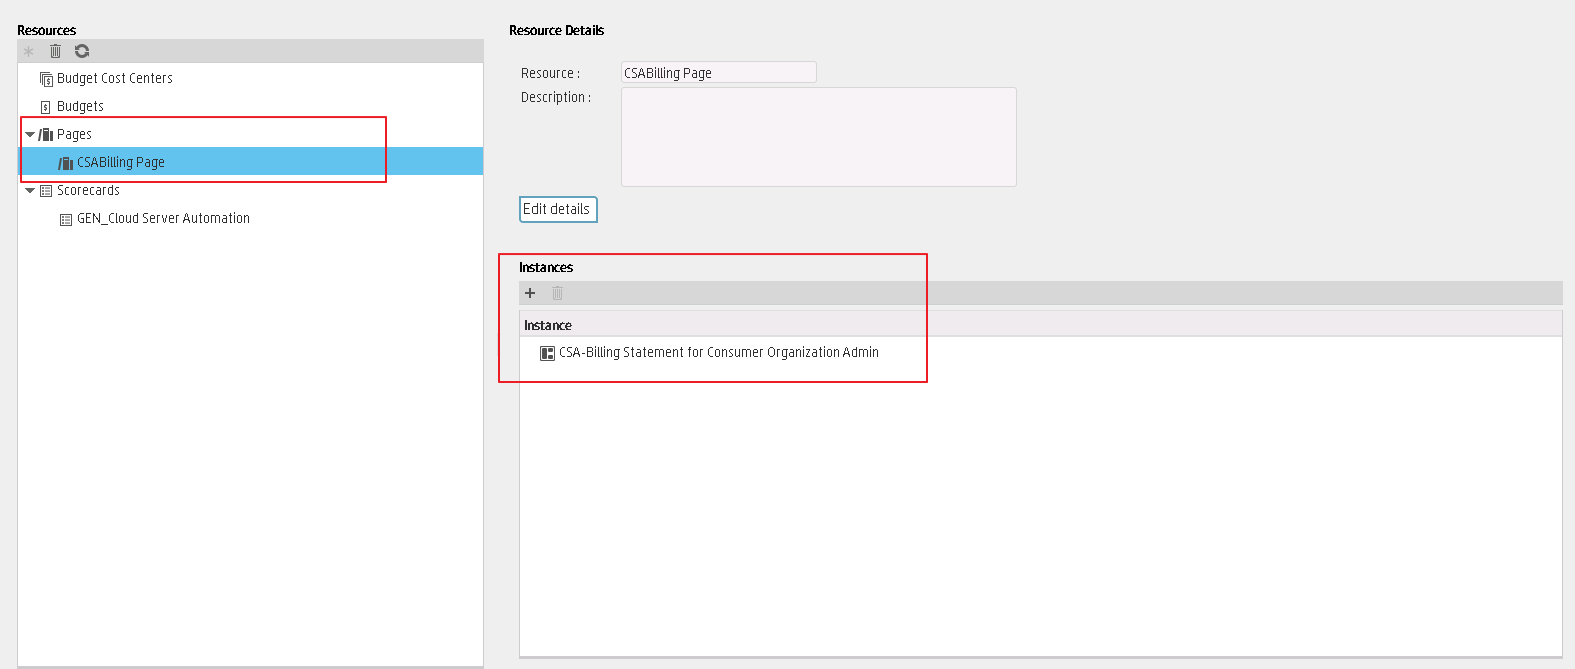
Create the resource for the CSA-Showback for Consumer Organization Admin page.
-
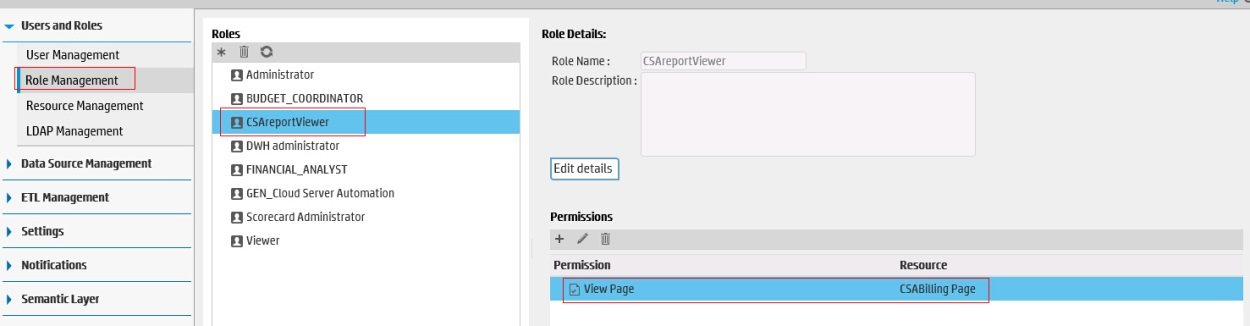
Create the CSAreportviewer role.
-
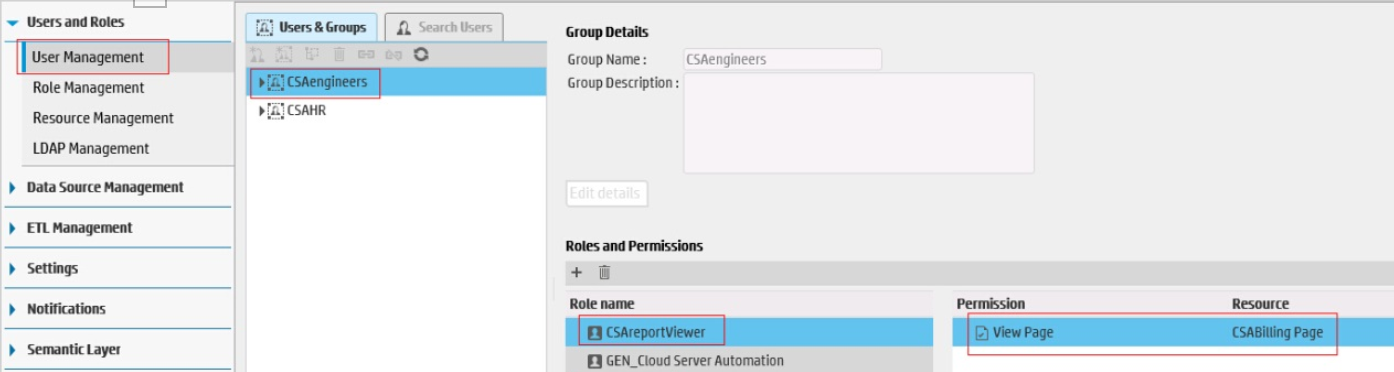
Assign the role CSAreportviewer to two groups.
-
Configure LDAP with BOE. For details, see LDAP in BusinessObjects.
-
Configure the group permission in the BOE server:
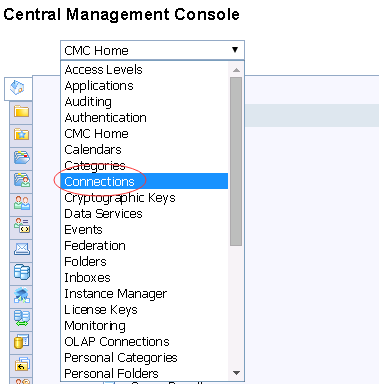
- Log on to BusinessObjects Central Management Console (http:// <local BOE server name>:8080/BOE/CMC) using the administrator name and password and configure LDAP with BOE. For details, see LDAP in BusinessObjects.
-
Open the Connections:
-
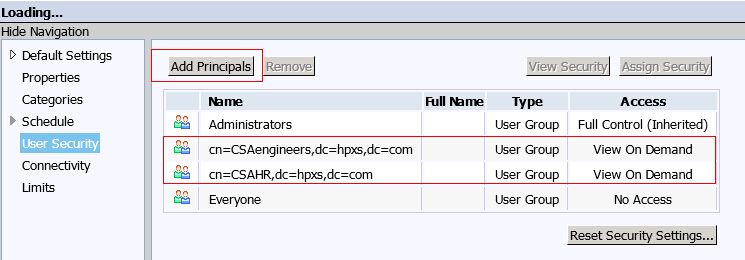
Select the XS_DWH_JDBC connection that your report uses and click User Security.

-
Grant the View On Demand permission to the two groups.
-
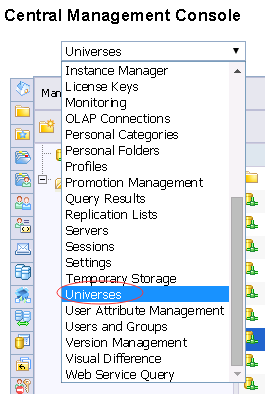
Open the Universes.
-
Select the CloudBilling universe that your report uses and click Universe Security.
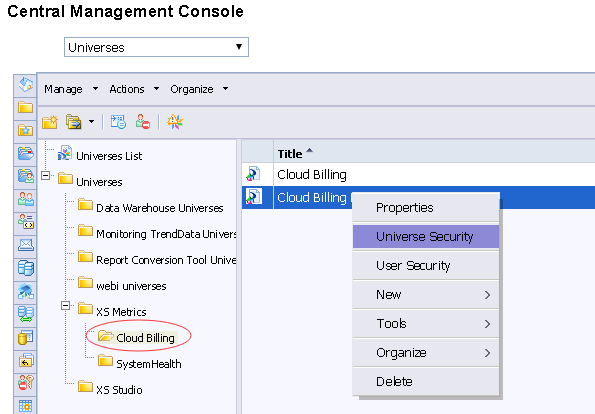
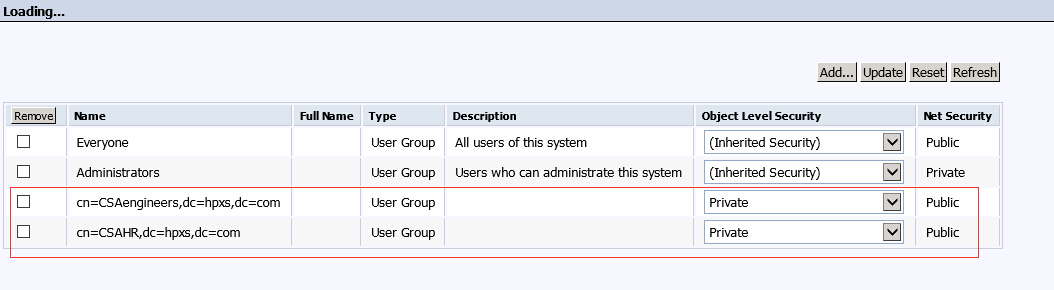
-
Add the Private security to the two groups.
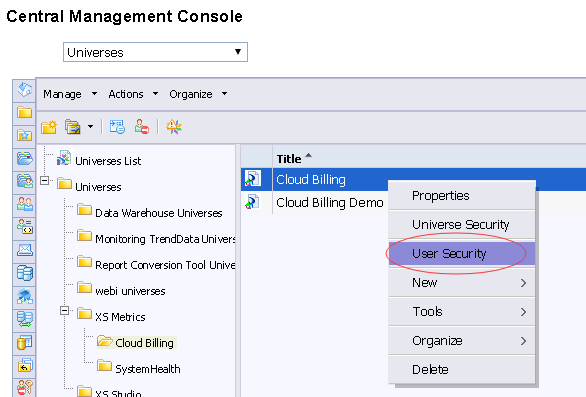
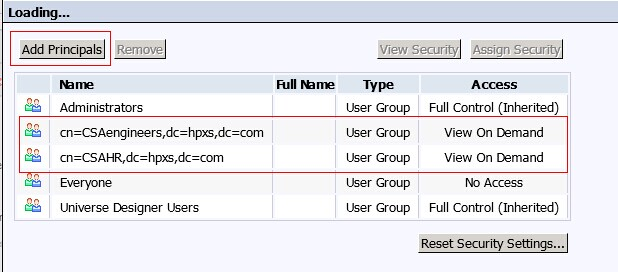
-
Grant the View on Demand permission to the 2 groups in User Security.
-
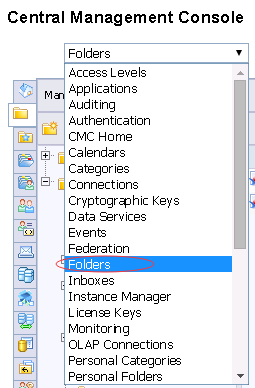
Select Folders.
-
Select the Showback for Consumer Organization Admin report and click User Security.
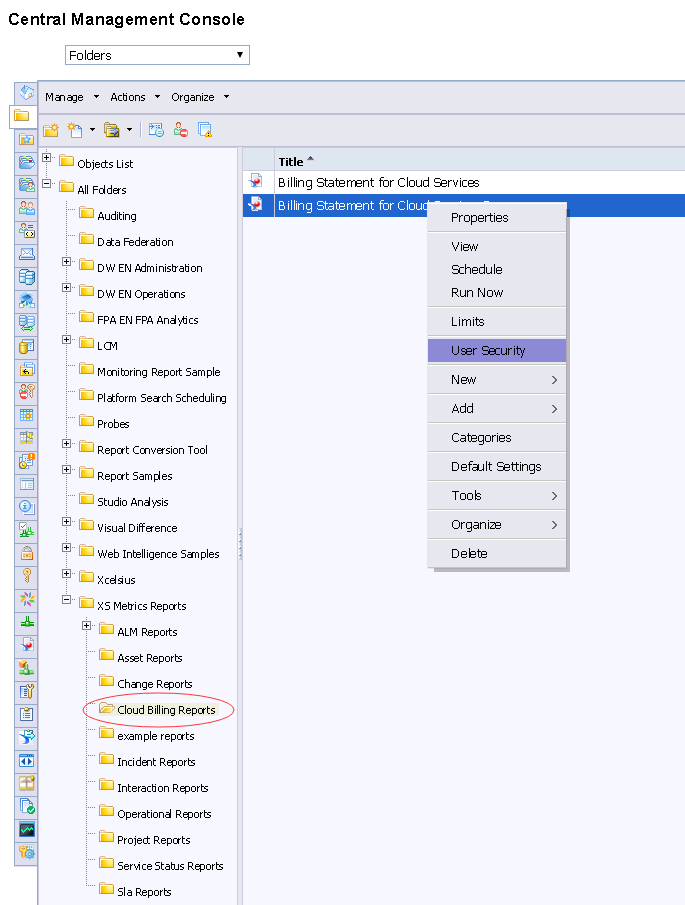
-
Grant the View On Demand to the 2 groups.

Step 2 - Configure the restriction of Cloud Billing universe
-
Configure the restrictions of the Cloud Billing universe:
-
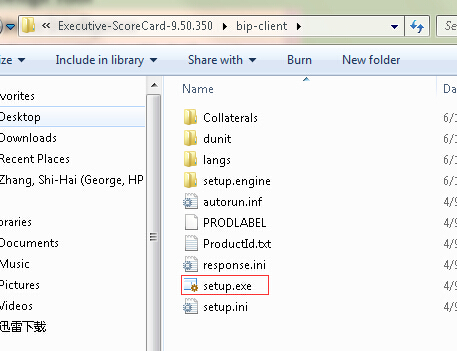
On the BOE server, install SAP BusinessObjects BI platform 4 Client Tools. Unzip the bip-client.ZIP file from installation file and click setup.exe to install it.
-
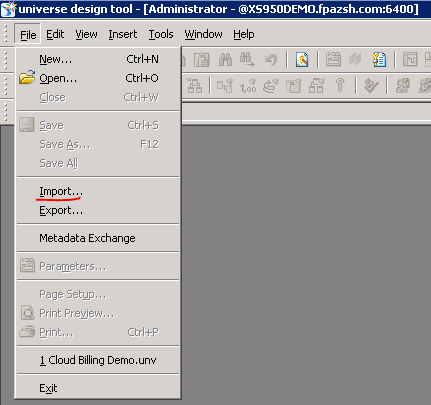
Open the Universe Design Tool.
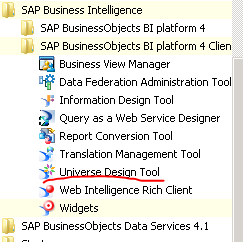
-
Log on to the Universe Design using the BOE administrator.
-
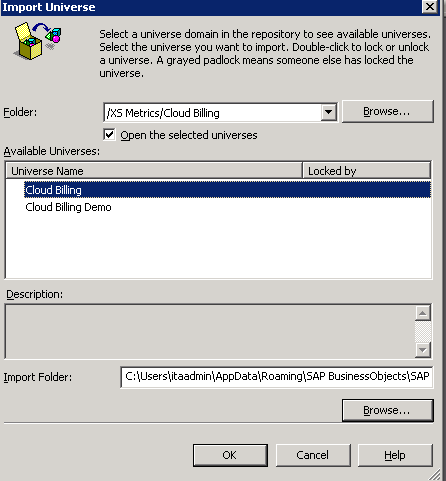
Click the Import button.
-
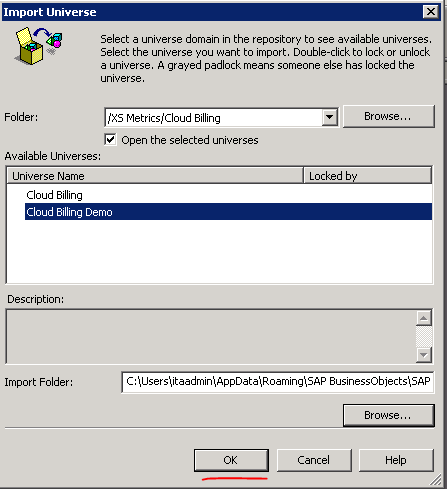
Open the Cloud Billing universe.
-
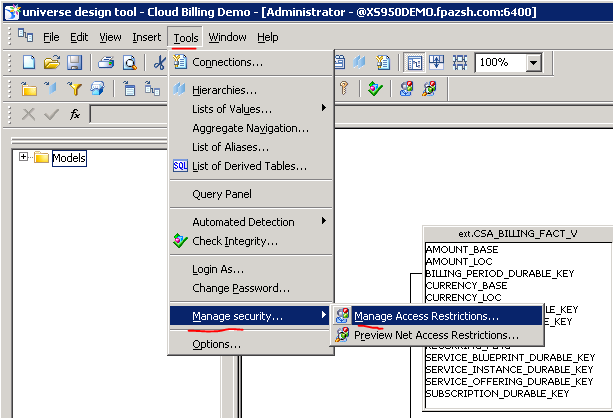
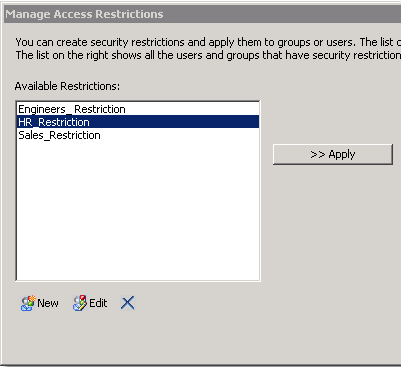
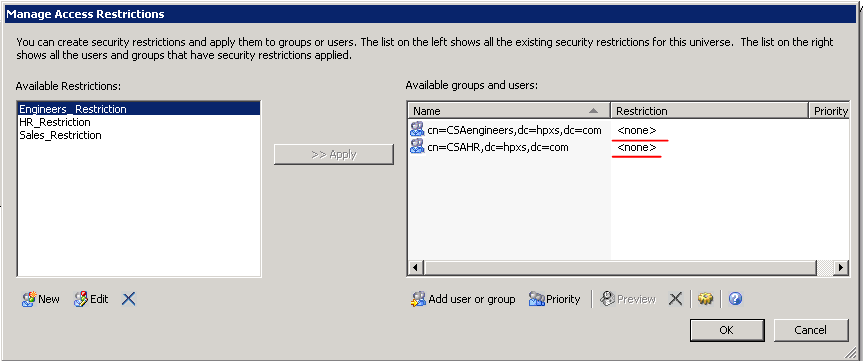
Add the relevant restrictions in the Manage Access Restrictions wizard:
- Engineer_restriction is set for CSAengineers which is configured to see only the engineering group’s data.
- HR_restriction is set for CSAHR which is configured to see only the HR group’s data.
-
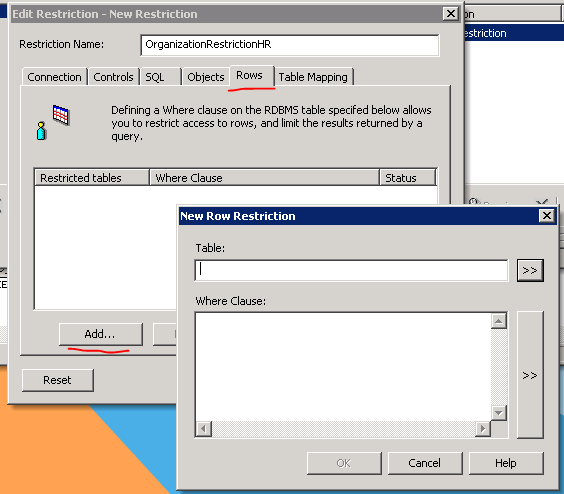
- Click New in the wizard.
-
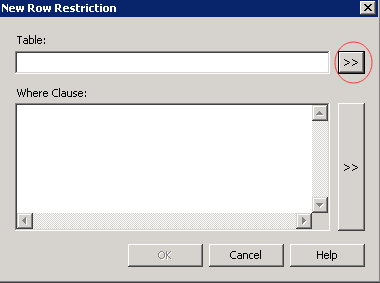
Click the Rows tab and click Add....
-
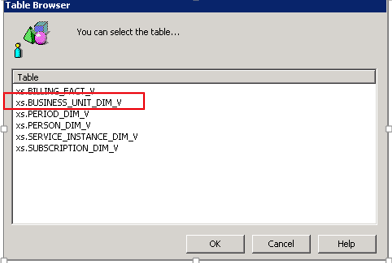
Select the XS_BUSINESS_UNIT_DIM_V table in the Table list, and set the SQL query in as follows:
-
Click OK.
-
Add restrictions1 as XS.BUSINESS_UNIT_DIM_V.Name = ‘Engineering’.
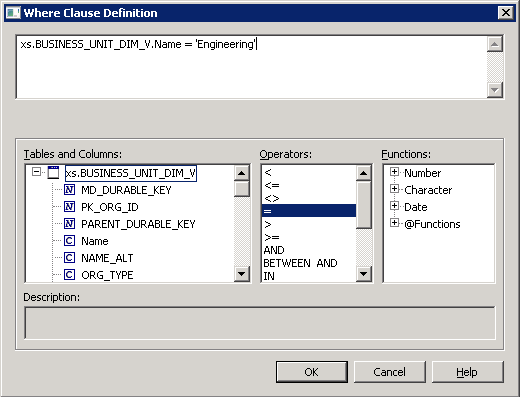
-
Click OK.
-
Repeat the steps from Create the restriction. to create the second restriction.
-
-
Click the Add user or Add group button, select the user and click the > button.
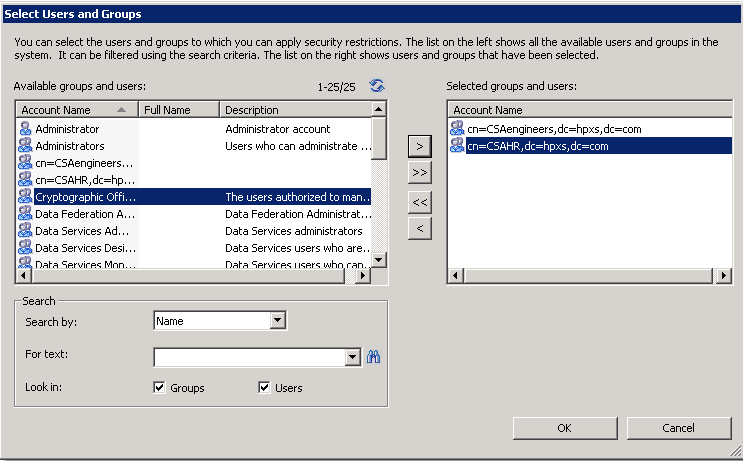
-
Click OK.
-
Select Engineers_Restriction in Available Restrictions area, select the CSAengineers group in the Available groups and users area, and then click the >>Apply button.
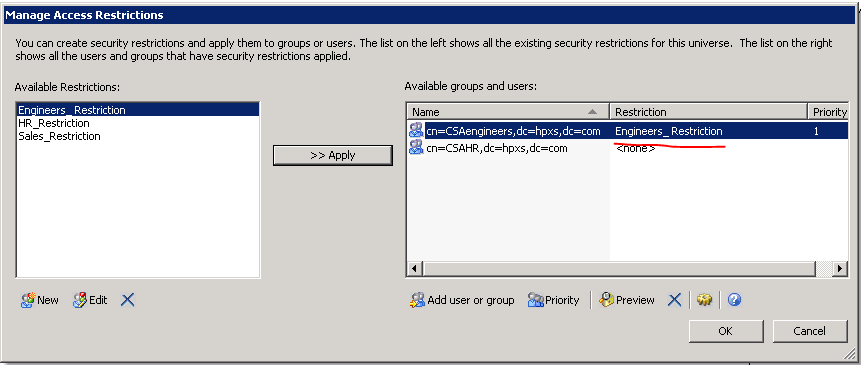
-
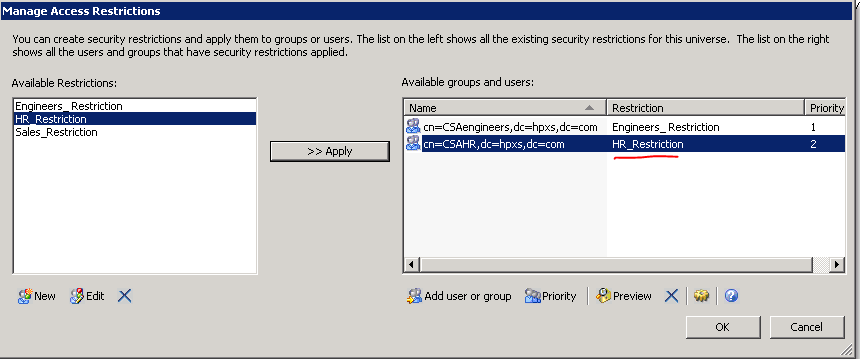
Repeat the previous step for the HR_Restriction and the HR group.
-
Click Export...
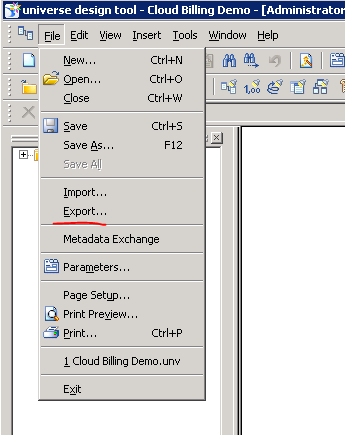
- Click OK.
-
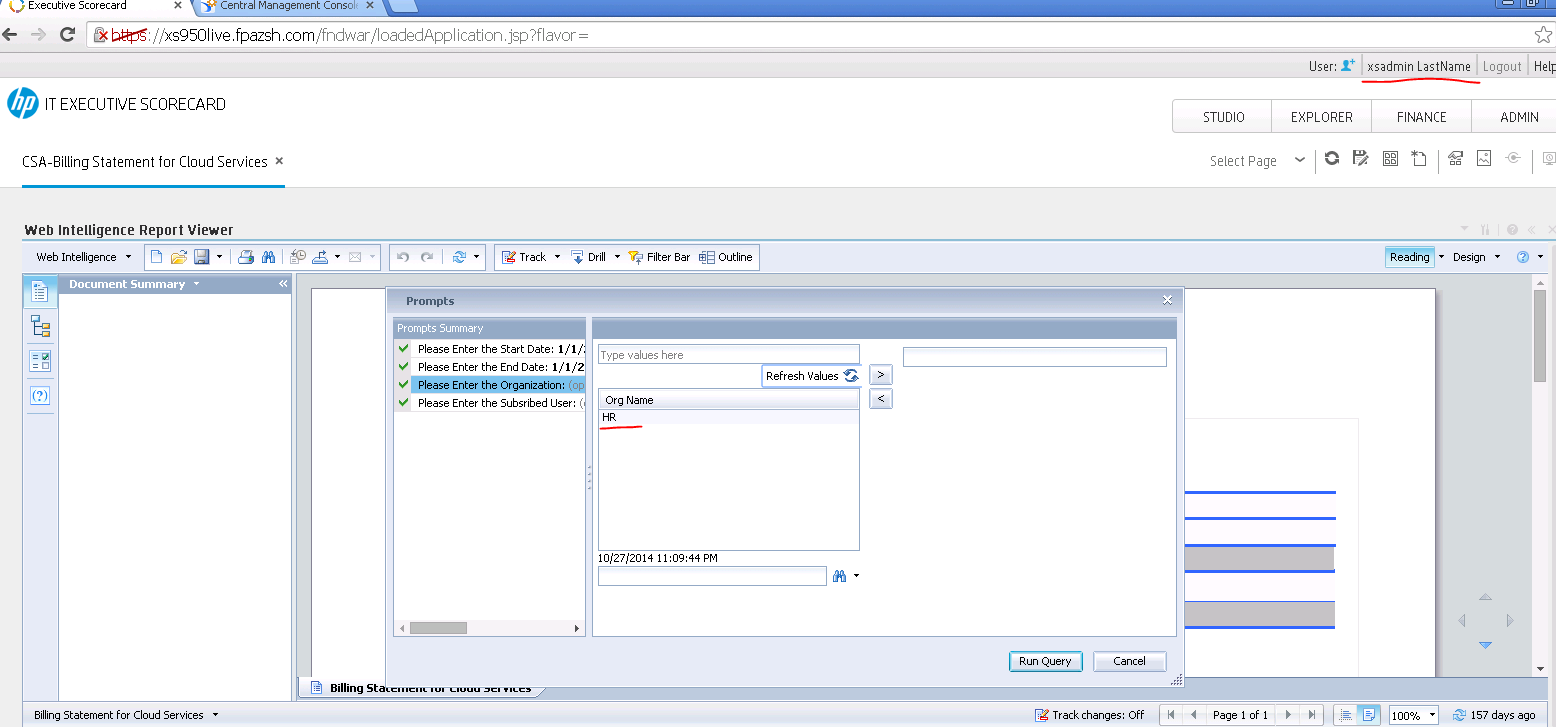
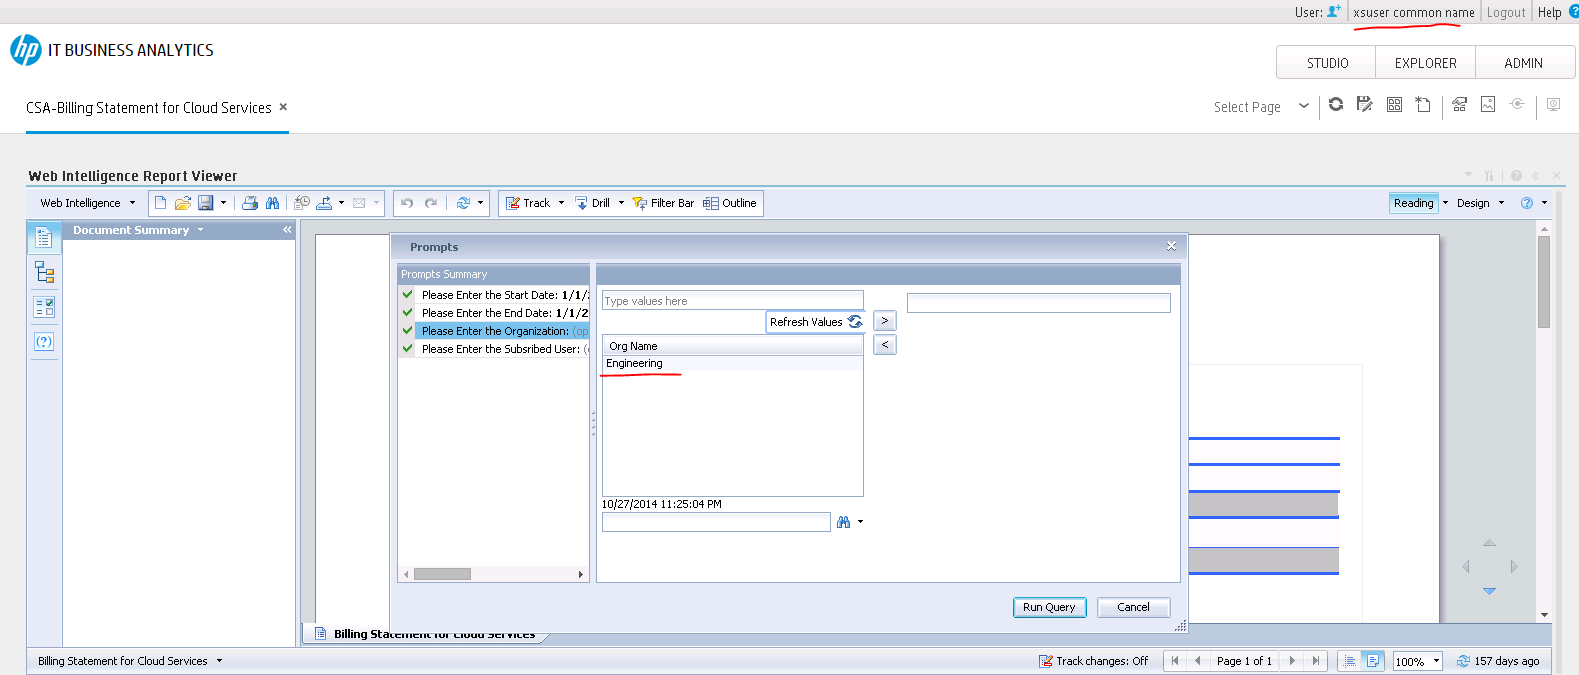
Log on to BA as the HR group one user and open the CSA billing report in the Dashboard.
-
Click the Refresh button to display the following value for Org Name.
-
Log on BA as the Engineers group one user and open the CSA billing report in the Dashboard.
-
Click the Refresh button to display the following value for Org Name.
Step 3 - Configure the Business Analytics tile in the CSA Market Place Portal
To enable and configure the Showback report on the CSA Market Place Portal for the Consumer Organization Administrator persona:
- Locate the %CSA_HOME%\portal\conf\dashboard.json file.
-
In the file, locate the section below and in the highlighted url replace the <CONFIGURE_HOST_NAME> placeholder with the host name of the BA instance.
{ "label": "common.section.ADMINISTRATION.label", "role": ["CONSUMER_ORGANIZATION_ADMINISTRATOR"], "tiles": { "default": { "className": "light-gray" }, "items": [{ "label": "common.items.MANAGE_USER_SUBSCRIPTIONS", "icon": { "className": "icon-manage-subscriptions" }, "link": "#/user/manage" }, { "label": "common.items.SCORECARD", "icon": { "className": "icon-status" }, "link": { "url":"https://<CONFIGURE_HOST_NAME>/fndwar/loadEmbeddedPage.jsp?com.hp.bsm.uim.pageUID=ef63ab7f-b86b-43c8-b8d8-bb81869b73dc", "target": "_blank" } }] } } - Save.

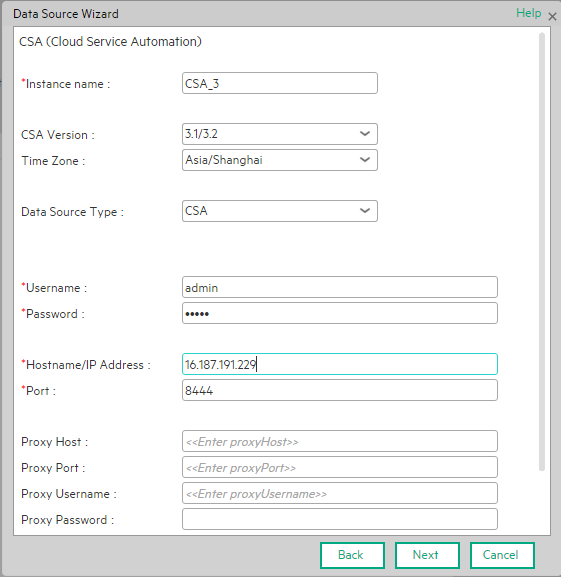
CSA Activation Page
The following is an example of the CSA Activation page.
User interface elements are described below:
Note If the CSA configuration is for a named instance connection, make sure to enter the named instance port.
|
UI Element |
Description |
|---|---|
| Instance name | Enter a name for the data source instance you are activating. |
| CSA Version |
Select the relevant version. . For details, see the .. |
| Time Zone | Select the time zone for the data source. |
| Data Source Type |
CSA This parameter is read only. |
| Username | Enter your admin username used to log on to CSA. The default username is admin. |
| Password | Enter your admin password used to log on to CSA. The default admin password is cloud. |
| Hostname/IP Address |
Enter the CSA server hostname or IP address. |
| Port | Port for REST API (default value is 8444). |
| Initial Load Period (months) | Select the number of months from which you want the initial data loaded. |

CSA-Related KPIs and Metrics
For a list of the KPIs and Metrics related to the Cloud Service Automation data source, see KPIs and Metrics.
KPIs, Metrics, and Webi Reports and the Integrations with CSA, AWS,
AWSCW,
Azure, and CO
| KPIs and Metrics | KPI and Metrics Related Target Entities | CSA | CSA +AWS |
CSA +Azure |
CSA +CO |
CSA +AWS +Azure +CO |
|---|---|---|---|---|---|---|
|
Average Cost of IT Services KPI.. The average cost of services provided by IT. |
AWS
CSA:
|
X | X | X | X | X |
|
Average Cost of Resource Providers KPI. The average cost of the Resource Providers during the measurement period. |
AWS
CSA:
|
X | X | X | X | |
|
Average Expense for Services KPI. The average expense of services consumed by the organization. |
CSA:
|
X | X | X | X | X |
|
Average Revenue of Services KPI. The average revenue of services provided by IT during the measurement period. |
CSA:
|
X | X | X | X | X |
|
Number of Service Subscriptions KPI. The number of Service subscriptions created during the measurement period. |
CSA:
|
X | X | X | X | X |
|
Percentage of DiskSpace Utilization KPI. The average of percentages of diskspace utilization at instance level. |
AWS
CSA:
|
X | X | X | ||
|
Percentage of Memory Utilization KPI. The average of percentages of memory utilization at instance level. |
AWS
CSA:
|
X | X | X | X | |
|
Percentage of Pagefile Utilization KPI. The average of percentages of pagefile utilization at instance level. |
AWS
CSA:
|
X | X | |||
|
Percentage of Server Utilization KPI. The average of percentages of CPU utilization at instance level. |
AWS
CSA:
|
X | X | X | X | |
|
Percentage of Swap Utilization KPI. The average of percentages of swap utilization at instance level. |
AWS
CSA:
|
X | X | |||
|
Percentage of Volume Utilization KPI. The average of percentages of volume utilization at instance level. |
AWS
CSA:
|
X | X | |||
|
Public vs Private Cloud Spending KPI. The ratio between the public and the private spending. |
AWS
CSA:
|
X | X | X | X | |
|
Service Profit Margin KPI. The profit margin of the services provided by IT during the measurement period. |
AWS
CSA:
|
X | X | X | X | |
|
Service Subscription Lifespan KPI. The average lifecycle time of a subscription to a service during the measurement period. |
CSA:
|
X | X | X | X | X |
|
Total Cost of IT Services KPI. The total cost of services provided by IT during the measurement period. |
AWS
CSA:
|
X | X | X | X | |
|
Total Cost of Resource Providers KPI. The total cost of the Resource Providers during the measurement period. |
AWS
CSA:
|
X | X | X | X | |
|
Total Expense for Services KPI. The total expense of services consumed by the organization. |
CSA:
|
X | X | X | X | X |
|
Total Revenue of Services KPI. The total revenue of services provided by IT during the measurement period. |
CSA:
|
X | X | X | X | X |
|
Amount of Used Disk Metric. The product of the amount of disk provisioned and the number of days the VM has been running. For example, if a VM has been running with 20 GB of hard disk for 5 days, the DiskDays is calculated as 20x5 = 100 Disk (GB)-Days. |
AWS
CSA:
|
X | X | |||
|
Amount of Used Memory Metric. The product of the amount of memory allocated and the number of days the VM has been running. For example, if a VM has been running with 4 GB of memory for 5 days, the MemDays is calculated as follows: 5x4 = 20 Memory (GB)-Days. |
AWS
CSA:
|
X | X | |||
|
Amount of Used Storage Metric. The number of TBs of storage that are currently in use. |
AWS
CSA:
|
X | X | |||
|
Computer Hours Metric. The number of hours during which the VM has been running. |
AWS
CSA:
|
X | X | X | ||
|
Incoming Network Traffic Metric. Network Download. |
AWS
CSA:
|
X | X | |||
|
Network Traffic Metric. Total network traffic. |
AWS
CSA:
|
X | X | |||
|
Number of Used CPUs Metric. The product of the number of CPUs and the number of days the VM has been running. For example, if 4 CPUs are used for the first 15 days and 8 CPUs are used for the next 15 days in a month, the CPUDays is calculated as follows: (4x15)+(8x15) = 180 CPUDays |
CO:
CSA:
|
X | X | |||
|
Number of Used Instances Metric. The number of dedicated instances you are running in your hybrid cloud environment. |
AWS
CSA:
|
X | X | X | X | |
|
Outgoing Network Traffic Metric. Network Upload. |
AWS
CSA:
|
X | X |
Reports
| Webi Reports | Webi Report Related Target Entities | AWS |
CSA |
CSA +AWS |
CSA +Azure |
CSA +CO |
CSA |
|---|---|---|---|---|---|---|---|
|
AWS
|
X | X | X | ||||
|
CSA-Showback for Cloud Services Page(Billing Statement for Cloud Services) |
CSA:
|
X | X | X | X | X | |
|
CSA:
|
X | X | X | X | X | ||
|
CSA:
|
X | X | X | X | X | ||
|
CSA:
|
X | X | X | X | X | ||
|
CSA:
AWS
|
X | X | X | X | |||
|
CSA-Resource Usage and Utilization for Resource Supplier Manager Page |
CSA:
AWS
|
X | X | X | X |
We welcome your comments!
To open the configured email client on this computer, open an email window.
Otherwise, copy the information below to a web mail client, and send this email to SW-Doc@hpe.com.
Help Topic ID:
Product:
Topic Title:
Feedback: