in Service Health
Usually, you do not need to change the settings in Service Health, because most of the processes happen automatically. However, in certain cases you may have to customize the default settings in Service Health.
The following scenarios describe examples of these use cases.
Situation
One of your Service Health consumers is an application owner who is exclusively interested in his application's availability. However, the health perspective he uses also shows the application's performance data, which he does not want to see reflected in the application status.
Solution
If irrelevant indicators contribute to the CI status displayed in a certain view, you can change this in the KPIs in Views menu.
- Access Administration > Service Health > KPIs in Views. Select the view used by the consumer.
- Click the check boxes for Include in view and Include in status as required so that only the relevant KPIs are used for the CI status calculation.
Situation
In a cluster setup, you have a cluster CI which should reflect the overall health of the cluster. However, due to the out-of-the-box configuration, the Software Availability KPI of the cluster is calculated using the Worst Status Rule. Every time one of the cluster nodes is down, the cluster CI displays a critical status for the entire cluster.
In order to represent the overall health of the cluster, you want the cluster CI's status to appear critical only when all of the nodes are down.
Solution
Depending on the size of your cluster, you can either change the rule directly in CI Customizations for the CI, or you can add a new KPI that reflects the cluster availability based on the Best Status Rule, and assign it to the CI type.
-
Option 1: Change the KPI's business rule to the Best Status Rule, for that specific CI
- Access Administration > Service Health > CI Status Calculation > CI Customizations. Select a view that contains the cluster CI.
- The KPIs tab in the right pane shows all KPIs that are assigned to the cluster CI. Select the Availability KPI and click
 Edit.
Edit. - In the KPI section, change the business rule of the KPI to the Best Status Rule. Click Save.
-
Option 2: Add a new KPI that reflects the cluster availability
- Access Administration > Service Health > CI Status Calculation > KPI Definitions. In the middle pane, click
 New.
New. - Define the properties of the new cluster availability KPI. In the Rules section, select the Best Status Rule as applicable rule. Click Create.
Note Alternatively, you can duplicate the existing Software Availability KPI, and change the display name and rule as required.
- Access Administration > Service Health > CI Status Calculation > KPI Assignments. In the left pane, select the cluster CI's CI type, and click New to add a new assignment.
- Define the properties as required, and select the KPI you just created in the KPI Configurations section. Click Create.
- Select Apply all rules to apply the new rule to the cluster CI's CI type.
- Access Administration > Service Health > CI Status Calculation > KPI Definitions. In the middle pane, click
Situation
You monitor a custom software in OMi for which there is no existing Management Pack. However, you want Service Health to display a Software Availability KPI that indicates the software's status.
Solution
To monitor if the custom software is running, start by creating a CI for the software. Create and assign HIs with the up and down status of the software. Finally, create a monitor (for example by using SiteScope) to check whether the custom software is running or not.
For a detailed workflow, follow these steps:
-
Access Administration > RTSM Administration > Modeling > IT Universe Manager. In the left pane, switch to Search CIs, and find and select the node CI on which the software is installed.
-
In the middle pane, click New Related CI.
Make sure to enter values for the attributes Name, Product Name, and Discovered Product Name. Set the User Label attribute if you want to override the default label of the CI.
As relationship, select Composition. -
Access Administration > Service Health > CI Customizations. In the left pane, select the CI you just created from a view in which it is contained.
-
Access Administration > Service Health > Indicator Definitions. In the left pane, select the CI type of the CI you created. Create a health indicator for the software status with two states: up and down.
-
Access Administration > Service Health > KPI Assignments. In the left pane, select the CI type of the CI you created. Create a new KPI Assignment for the HI that reflects the software status, to affect the Software Availability KPI.
Click
 Apply all rules to apply the new assignment retrospectively to all existing CIs.
 -
Create a URL monitor to check if the custom software is running.
-
Make sure that the monitor is configured to report the correct topology and does not create a duplicate CI. The CI attributes must be equal to the attributes set earlier: CI Name, Node CI Primary DNS Name, Product Name, Discovered Product Name
-
Optional. You can test the result by stopping the custom software.
Situation
Service Health in OMi is calculated based on Event KPIs and HI-based KPIs.
Event KPIs are the Unassigned Events and Unresolved Events KPIs, which calculate the status of a CI based on the CI's open events with the highest severity.
HI-based KPIs calculate the status of a CI based on the health indicator status, which is driven by events containing an Event Type Indicator (ETI) of the same name. In contrast to Event KPIs, the status of HI-based KPIs does not change based on whether an event is open or closed, as the HI status changes only when another event changes the HI or if you reset the HI status.
In this example, you do not want to see a critical CI status just because a critical event arrives in the browser for that CI. You want to change the default Service Health behavior to calculate the health status based on HI-based KPIs only. This way, your Service Health will not be influenced by event severity.
Solution
You can either decide to not use Event KPIs at all, or to use Event KPIs in some views, but not in all.
-
Option 1: Do not use Event KPIs in any of the Service Health calculations
- Access Administration > Service Health > CI Status Calculation > KPI Assignments. In the left pane, select the CI type ConfigurationItem.
- Select OMi KPI Assignments and click Stop.
- Click Synchronize CI Type to apply the change to all CIs.
Note To revert this action, click Revert and then click Synchronize CI Type again.
-
Option 2: Use Event KPIs in some views, but not in all
- Access Administration > Service Health > KPIs in Views. Select the view that you want to change, and locate the KPIs Unassigned Events and Unresolved Events.
- If you want to see the Event KPI in the view, but you do not want it to contribute to the overall CI status, clear the Include in CI Status check box.
If you do not want to see the Event KPI in the view at all, clear the Include in View check box. When you select the view in Service Health (for example Top View), it will look as if the KPI did not exist.
Situation
Out-of-the-box, the KPIs Unassigned Events and Unresolved Events report a CI's number of events with the highest severity. These Event KPIs are not propagated from child CIs to parent CIs, because it is their purpose to notify users that a specific CI has unassigned or unresolved events.
However, to reproduce the default approach that was used in Operations Manager, you want to propagate the Event KPIs to the parent, and then have the parent report a sum of the most critical events for each Event KPI.
Solution
Create a new KPI Assignment (using the Sibling Rule) for the CI type in question, and apply the KPI Assignment to the CIs.
- Decide for which CI type you want to display the sum of most critical events. For example, you might want to show the total of the most critical events for all CIs of the CI type CiCollection.
Note It is also possible to display the sum of the most critical events for all CI types, but this might not be useful. Consider, for example, IpAddress CIs which typically do not have events or child CIs. Event KPIs for these CIs would have an "Unknown" status.
- Access Administration > Service Health > CI Status Calculation > KPI Assignments. In the left pane, select the CI type for which you want to display the sum of the most critical events.
- Duplicate OMi KPI Assignments, and change the display name of the duplicated assignment.
-
Edit the KPIs Unassigned Events and Unresolved Events and change the Business Rule to the Event KPI Group And Sibling Rule (OMi).
Example
A parent CI has two child CIs with events. One child CI has 1 critical and 4 major events. The other child has 2 major and 1 normal events. By using the Event KPI Group And Sibling Rule, the parent shows 1 critical event. If the critical event is resolved, the parent shows 6 major events (because that is the next highest severity in the group).
- Save the KPI Assignment.
- Click Synchronize CI Type to update the KPI assignments of all CIs with the selected CI type.
- Optional. By default, the number of events are displayed with a single decimal separator, e.g. 2.0. To format the number of events as an integer instead, access Administration > Service Health > CI Status Calculation > KPI Definitions. Edit the Unassigned Events and Unresolved Events KPIs. In the Presentation section, select getIntValue as the formatting methods.
Situation
You have a custom HI (reflecting the health of a computer's CPU) that is not associated with a SiteScope monitor. However, you want to enrich the default SiteScope HI content with additional metrics monitored by SiteScope.
Solution
-
Open the Indicator Definitions page:
Administration > Service Health > Indicator Definitions
Alternatively, click Indicator Definitions.
Select the Computer CI type.
-
Create a new HI named Computer CPU, and set its states to Critical, Minor, and OK.
Note the unique ID of the newly created HI as you will need it in the next steps of this procedure (you can view it in the details pane of the HI when it is selected after creation).
-
Open the KPI Assignments page:
Administration > Service Health > KPI Assignments
Alternatively, click KPI Assignments.
Select the Computer CI type, and then select SiteScope Related KPIs Assignment and click
 Duplicate.
 -
In the Edit KPI Assignment panel, add the System Performance KPI to the KPI configuration, and define it as calculated based on the new HI.
-
Edit the
meas2eti.xmlfile.Note To edit the
meas2eti.xmlfile, use the‑exportoption of the opr-sis-file-manager CLI. For more information, see opr-sis-file-manager Command-Line Interface.Modify the
meas2eti.xmlfile by mapping the CPU monitor (<monitorType value="CPU">) to the Computer CPU HI:-
Enter
Computeras the CIT (ciType="host_node"). -
Check that the
/utilization.*/string is entered asmeasurement(this is the default value). -
Enter the unique ID of the HI as
eti(eti="<HI's unique ID>").
-
-
Upload the modified file back to OMi using the
‑importoption of the opr-sis-file-manager CLI. For more information, see opr-sis-file-manager Command-Line Interface. -
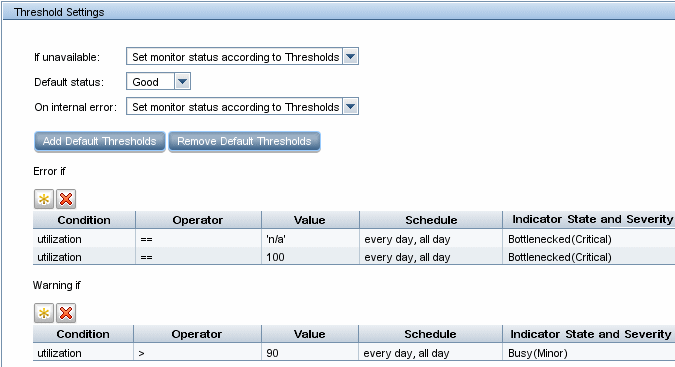
On the SiteScope server, create a CPU monitor within the Summary tab. In the monitor's Properties > Threshold Settings area, define the indicator states and severities. When you finish, run the monitor.
-
Open Top View. Select the System Hardware Monitoring view and verify that the monitored CI has the correct HI and the correct HI value and color.