


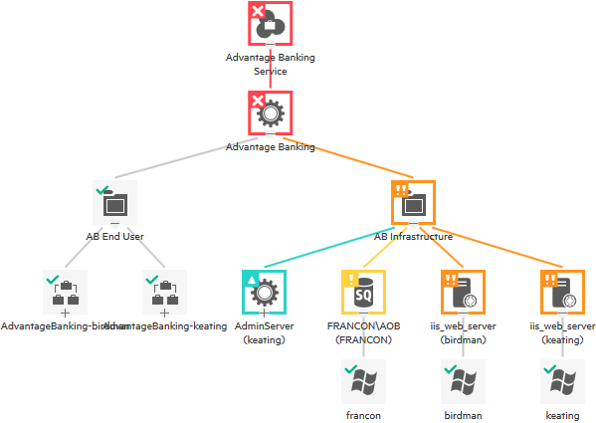
Service Health enables you to quickly recognize the impact of a problem on your organization's business services and applications. Different levels of measurement build on and combine with one another based on predefined rules to present a broad picture of system health, rooted in fine-grained data. In the following image, you can see CIs in a tree, displaying colors based on health status. But where do the colors come from and how are the statuses calculated?
The building blocks of Service Health are event type indicators (ETIs), health indicators (HIs), and key performance indicators (KPIs). They each represent a different level of health measurement detail.
ETIs are categorizations of events. They indicate the type of activity that triggered the event, based on the CI type context. Different data sources may result in events with different attributes, like title or category, that still represent the same thing, like a Node Down state. ETIs can normalize these events into a common type for use in Service Health and correlation.
HIs are fine-grained measurements that reflect the state of a CI based on a particular operating characteristic. A change in a health indicator state affects the KPI status, as well as the ETI status of a CI. Each HI is also an ETI (but not the other way around).
KPIs represent the overall status of CIs. They are high-level indicators of CI performance and availability. Based on business rules, the KPI status is calculated by using the statuses of one or more HIs, one or more KPIs, or a combination of both.
CIs (configuration items) are components of your IT infrastructure. Each CI can have multiple KPIs, which, in combination, reflect the CI's status. By using CI Status Alerts, you can trigger alerts for critical CIs if there is a KPI status change.
CITs (configuration item types) are groups of CIs with similar properties. Each CI must belong to a CI type, and each CIT provides a template for creating a CI and its associated properties. Each CIT has various ETI definitions, as there are certain types of events that can occur on a CI.

An analogy: indicators and physical health
To better understand the different levels of health measurement in Service Health, let's use an analogy: your physical health. Imagine you go to the doctor and tell him, "I'm really not feeling well." He asks you what exactly is feeling bad, and you tell him, "My digestion is all messed up." The doctor runs some tests and tells you, "Your stomach pH is much too low and you're missing some crucial bacteria in your large intestine." He prescribes you some medicine and you're feeling better in no time.
In the context of Service Health, you are a CI of CI Type (CIT) Human. Your digestive system is a KPI and its status is bad. There are other KPIs defined for CI Type Human, like the respiratory system or the circulatory system, but your digestive system is of concern because its KPI is reporting a negative status. Your doctor uses HIs to fine-tune his inspection; he knows exactly which components influence the digestive system KPI, and he can pinpoint those HIs when trying to find out what's causing the problem. In this case, he finds that two HIs, stomach pH level and intestinal bacteria, have negative states. As you can tell in this analogy, the levels of measurement build on one another. Two HIs, pH level and intestinal bacteria, were in such bad states that they made the status of your entire digestive system KPI bad. Since the KPI for your digestive system is so bad, even if other systems, like the circulatory system or respiratory system, have positive KPI statuses, the CI status (your overall health) is negative.
| Term | Analogy |
|---|---|
|
|
|
|
|
|
|
|
|
|
|
Stomach pH, |
Out-of-the-box Service Health behavior
Out-of-the-box, much of the Service Health process happens automatically. When an event arrives in OMi, the following steps occur:
-
Data collectors send events to OMi.
- The events contain hints that OMi can use to map the event to a CI and to an ETI.
- The Service Health logic component translates the ETI to an HI, automatically creates an HI if it is not yet present in the system, and maps the HI state to its status. At this stage the HI instance is ready to be used for further calculation.
-
The KPI engine calculates the KPI status based on the status change in the HI, according to the KPI business rule. KPI status is automatically propagated based on triplet rules defined in the impact model and exceptions defined in propagation rules.
- The information that has been processed (events, HIs, and KPIs) is displayed in the consolidated operation workspace.
- By default, all KPIs are available in all views, and you also have two event KPIs: the unassigned events KPI and the unresolved events KPI. These KPIs are not propagated.

In most cases, you don't need to change the Service Health default settings, as the out-of-the-box behavior automatically creates HIs and KPIs. However, in some cases you may want to adjust and customize Service Health to meet your organization's specific needs.
As an administrator, you should ask yourself the following questions before changing the default Service Health settings:
-
Who will be consuming Service Health data in my organization, what data are they interested in, and in which manner would they like to consume it?
For example, your CIO is interested in a high-level online health view of all business-critical services. The desired aspects are availability and performance; drill-down and over-time capabilities are required in case of availability or performance degradation. The data should be presented in a readable and simplified format as it is used during a daily status call with IT managers and is presented 24/7 on the CIO's office screen.
On the other hand, your IT application owner needs a detailed online view of her application including supporting hardware resources. She would like to be alerted whenever predefined thresholds are breached. As part of the event management or incident management process, the view will serve as the starting point for triage and discussion with other IT support groups or functions.
After thinking about the above, you can start planning the customizations you would like to make to the default Service Health behavior, including setting up views, changes to default rules, and so on.
-
Do I want to use the out-of-the-box Service Health behavior, as described above?
Installing management packs is one way to extend the monitoring reach of OMi without having to manually change the Service Health settings.
However, you may want to use your own monitoring policies, or find that certain information is missing or redundant for your organization. In these cases, you can perform customization and adjustments to fulfill your needs. For information on common customizations, see Customization Use Cases in Service Health.
-
Do I need more event KPIs?
Out-of-the-box, each CI is assigned two event KPIs: the Unassigned Events KPI and the Unresolved Events KPI.
Unassigned Events KPIs are calculated based on the severity and number of open and unassigned events related to a CI. The KPI status is the highest severity of all events and its value is the number of events with highest severity.
Unresolved Events KPIs are calculated based on the severity and number of events related to a CI with the state Open or In Progress. The KPI status is the highest severity of all events and its value is the count of events with highest severity.
Some cases where event KPIs are useful include:
- Simple CI status visualization: Event KPIs can provide a quick way to achieve CI status visualization, because they only take into account the severity and lifecycle state event attributes.
- Easy event dispatching: For users in a dispatcher role, event KPIs can provide an overview of events that are not yet assigned to anyone and events that are not yet resolved.
- CI status change based on lifecycle state: In some monitoring setups, events are only send for exception or error conditions, not for normal conditions, making it difficult to use health based KPIs. In these cases, event KPIs enable the KPI and CI color to change accordingly when a critical event for a CI is closed.
- Unpredictable events: Sometimes, especially when using third party domain managers, it's hard to know in advance what kind of events will arrive in OMi and thus it is difficult to map them to health based HIs and KPIs. Event KPIs can make it easier to visualize health in these situations.
Unlike health based KPIs, which provide a very granular level health information of a specific aspect of a CI, the default event based KPIs do not provide any specific health information about the CI. To make these KPIs more useful you can create more event based KPIs based on the subcategory attribute. You can count active events (unresolved and unassigned) for a specified event subcategory and display the result with associated KPIs. This means you can have KPIs like Unassigned Events – Security, Unresolved Events – Security for the security category, Unassigned Events – Network, Unresolved Events – Network for the network category, and so on. These KPIs provide a little more information than the default Event KPIs.
You can configure subcategories for which the event count based HIs should be calculated in the Operations Management - Health Indicators for Unresolved and Unassigned Events Infrastructure Settings. Corresponding HIs are automatically created as soon as a new subcategory is added in the Settings Manager.
These KPIs are not propagated. For more information see, KPI Definitions.
-
Do I want to use the default KPI propagation?
KPIs are propagated along triplet rules defined in the impact model in the RTSM. If you have certain cases where these default propagations needs to be overridden, you can define an exception in the form of a propagation rule. For more information, see Propagation Rules.