


Consolidated Event and Performance Management
In OMi, events from multiple sources are consolidated into a centralized console. 'Perspectives' provide operators with different levels of information about the events they are responsible for. For example, general event handling is done in the Event Perspective, while the Health Perspective provides additional service health-related information about the events. These perspectives are centered around the Event Browser.
Find out more about the following topics:
- Event information
- Monitoring Dashboards
- Health information
- Correlating events
- Suppressing duplicate events
- Closing related events automatically
- Stream-based event correlation
- Topology-based event correlation
- Event storm suppression
Event information
Events report important occurrences in the managed IT environment. They are generated by domain managers, forwarded to OMi, and then mapped to related configuration items (CIs) in the RTSM. These events are assigned to operators for resolution. In the Event Browser, operators can see a complete overview of all active events that need to be worked on. They can see such things as the event severity, the type and category of event, the source of the event, the time and location of the event, and the affected configuration item.
Events pass through a “lifecycle,” which is an informative way to display and monitor the status of an event. An operator’s workflow is based around the lifecycle of an event. The lifecycle state of an event represents the progress of the investigation into the problem that caused the event. An operator assigned to an event opens an investigation and works on finding a solution to the event’s underlying problem. Experts can then assess the proposed solution, verify that it solves the problem that caused the event, and close the event, which completes the lifecycle.
Operators can configure the Event Browser to suit the requirements of their typical workflows. The contents of the Event Browser are filtered according to the selected view or configuration item. Operators can configure new filters or modify existing filters, according to their needs, to change the information displayed. Filtering the Event Browser content helps operators focus on the most useful information, for example, to identify the highest priority events and to determine which of these events should be worked on first to minimize their impact on business services. You can also configure users and groups so that they can see only the events filtered by views associated with that user or group.
You can configure data collectors from HPE or third-party companies to forward events to OMi. Events are synchronized between servers. For example, OMi and OM synchronize the state of events and messages. If an OMi operator closes an event, a notification is automatically sent to OM. Similarly, OM notifies OMi about the acknowledgment of messages, and OMi automatically updates the lifecycle state of the corresponding events to “closed.”
Operators can enrich events with additional information, for example, by adding annotations to the event to either aid further problem resolution or to document what action has already been taken.
Closed events are automatically moved to the Closed Events Browser. Operators can access this list of closed events, and can use these events as a reference for solving similar problems.
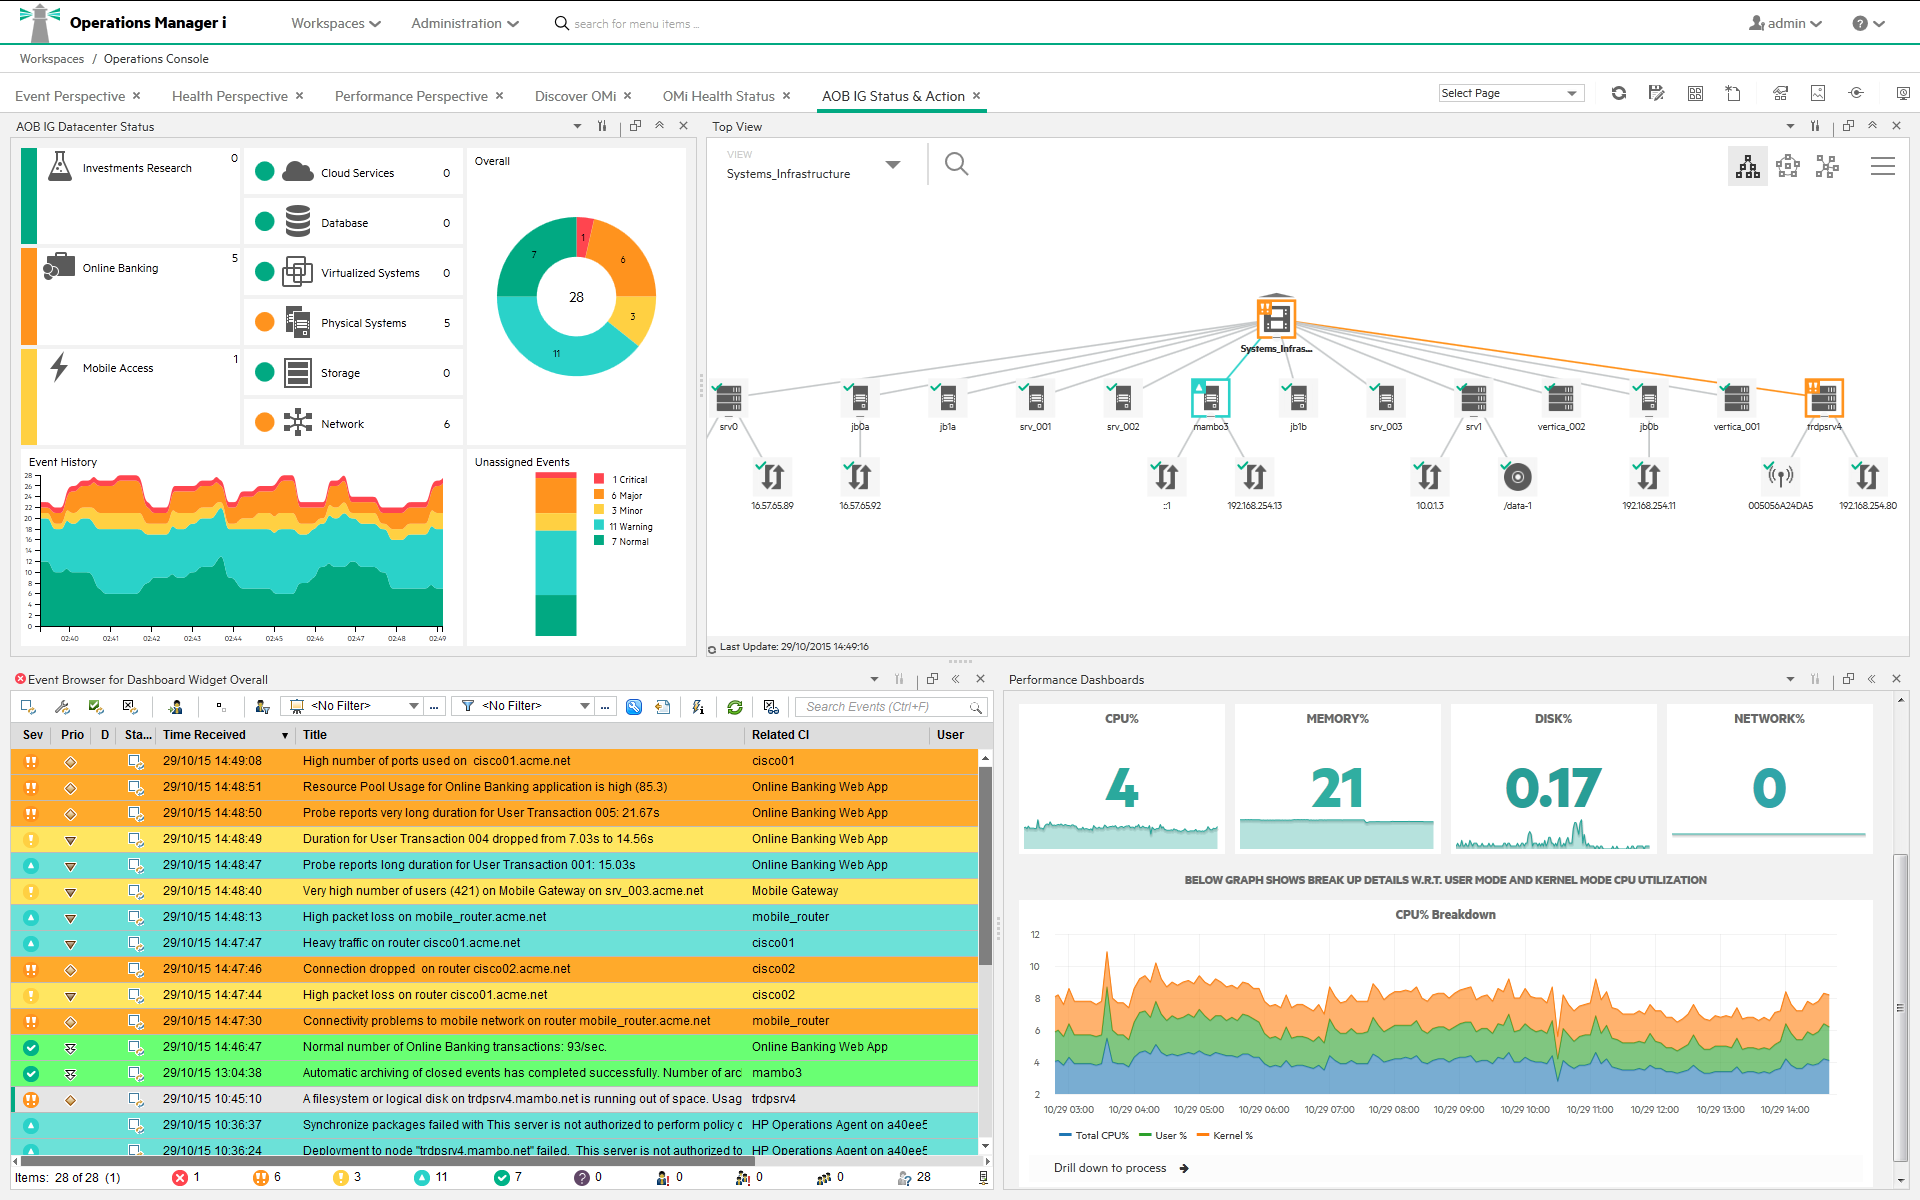
Monitoring Dashboards
Monitoring Dashboards provide you an at-a-glance overview of the events from your monitored environment. They enable you to quickly assess the health of the environment and to identify areas that require your attention.
Monitoring Dashboards help you to:
- Get an overview of your monitored environment
- Visualize a starting point for daily management operations
- Quickly apply event filters to the event browser
- Keep an eye on the monitored environment while working on an event
Monitoring Dashboards display status information by using widgets as building blocks (for example, stack and pie widgets). Each widget references an event filter, a view, or both, and only displays the status of those events that match the criteria of the filter and that are related to the configuration items included in the referenced view, making it easy to customize.
The following figure shows a Monitoring Dashboard screen:
Health information
With event-based data, you can see in the Event Browser which related CI is affected by the event. Additionally, OMi health data, such as event type indicators (ETIs), health indicators (HIs), and key performance indicators (KPIs) are used to evaluate the health of related CIs in the context of the events.
For any device, such as a server, the severity of the problems directly associated with the server are collated and combined with information about devices associated with the server. The combined data is passed to calculation rules that evaluate and set the key performance indicators that indicate the overall health of the object.
The figure below shows a Health Perspective screen, with the Health Top View showing a hierarchical overview of the relationships among the objects associated with the event.
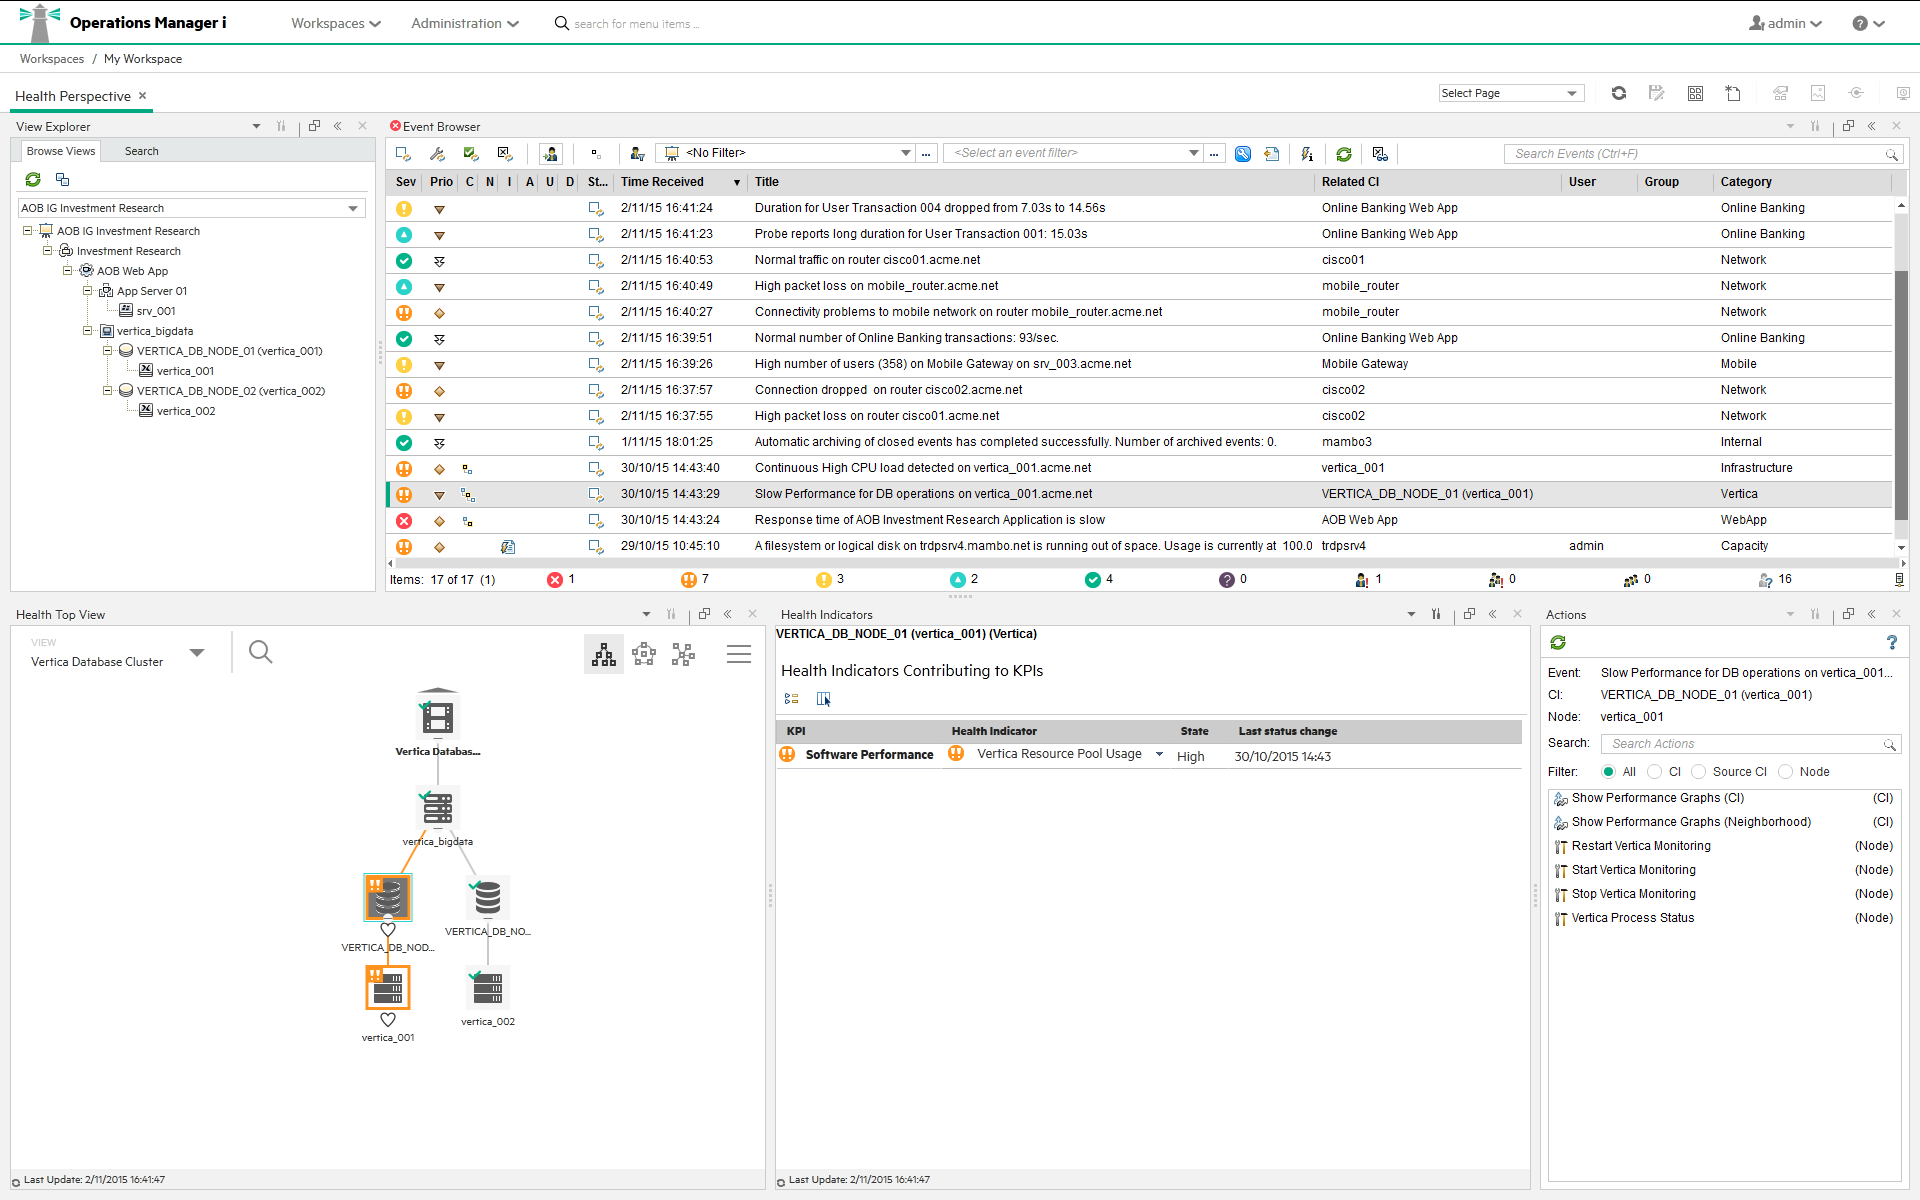
You can see the health status of an object, its KPIs, and Health Indicators, and see how the health status of the selected object affects the health of related objects. For example, you can navigate to check the health of neighboring CIs. This information helps you analyze which events to focus on, and prioritize event handling to maximize availability and minimize negative impact on business services. Users can also select views to show only the events and CIs they are responsible for.
For more information about KPIs, HIs, ETIs, and how Service Health in OMi is calculated, see Service Health Concepts.
Correlating events
In a large environment, one of the biggest challenges is how to manage the large number of events that originate from a variety of sources. Within this sea of data, the aim is to identify the events that have a significant impact on business services. So while it is essential to minimize the number of events that appear in the Event Browser, it is even more important to highlight the events that, if not managed properly, could cause a breach in service level agreements (SLAs) and generate incidents in your help desk system.
OMi correlates events automatically using the following forms of event correlation:
- Suppressing duplicate events
- Closing related events automatically
- Stream-based event correlation
- Topology-based event correlation
Suppressing duplicate events
A new event may be a duplicate of an existing event. As a simple example, due to network stability problems, the same event is sent twice by the source domain manager because it did not receive an acknowledgment quickly enough for the first instance of the event. As new events are received, they are checked against existing events. If duplicates are found, new information, such as a change in severity, is used to update the existing event, and the new event is ignored. If duplicate event suppression is enabled, new events that are duplicates of an existing event are not retained and the original event is updated.
The advantage of correlating events using duplicate event suppression is that it reduces the number of events displayed in the console, but without losing any important information.
Suppressing duplicate events can result in additional correlations of the original event (both as cause or as symptom). When a duplicate is identified, the timestamp for the original event is updated to the time when the duplicate was received. The event is then correlated again and may now be related to other events which were not available for correlation when the original event was received.
Closing related events automatically
A new event can automatically close one or more existing events. When a new event arrives, a search is made for existing related events. Some specific information contained in the new event is used to match the new event to any existing events, and the new event closes the existing event. This type of event correlation is similar to the “good/bad message correlation” provided by Operations Manager.
For example, an existing event may be a notification of a problem or abnormal condition (a bad event) for a particular device. The bad event could be “SQL Query Performance SLOW”. Consider a new event matching this existing related event which notifies that the abnormal condition no longer exists (a good event). The good event could be “SQL Query Performance OK”. The new (good) event closes the existing (bad) related event.
You can track related events that were closed automatically in the event history.
Stream-based event correlation
Stream-based event correlation (SBEC) uses rules and filters to identify commonly occurring events or combinations of events and helps simplify the handling of such events by automatically identifying the events that can be withheld, removed, or need a new event to be generated and displayed to the operators.
The following types of SBEC rules can be configured:
- Repetition Rules: Frequent repetitions of the same event may indicate a problem that requires attention.
- Combination Rules: A combination of different events occurring together or in a particular order indicates an issue and requires special treatment.
- Missing Recurrence Rules: A regularly recurring event is missing, for example, a regular heartbeat event does not arrive when expected.
Topology-based event correlation
The event management process is simplified not only by consolidating events from all sources in a central console, but also by categorizing events using topology-based event correlation (TBEC). Dependencies between events are analyzed to determine whether some events can be explained by other events. For example, consider a database server (DB Server) running on a server (Server1). If the Server1 CPU usage becomes persistently overloaded, the resulting event “SLA for DB Server breached” can be explained by the causal event “Server1: CPU persistently overloaded (100% for more than 10 minutes)”.
The key is to pinpoint the underlying causal events that are responsible for other symptom events, so that you can prioritize the resolution of these causal events based on the impact to your business.
If two events occur concurrently (within a configurable time span), TBEC correlation rules identify one event as the cause and the other event to be the symptom. Rule-based event management enables you to manage large numbers of similar (related) symptom events in a large network.
When any combination of cause and symptom event occurs in the monitored environment, the correlated events are flagged in the Event Browser. You can configure the Event Browser to display the root-cause event and a separate overview of all the symptom events, thus enabling you to drill down into the correlation process and browse through the hierarchy of correlated events.
Events can also be correlated across technical domains, such as databases, hardware, networks, and web applications. This comprehensive scope enables you to correlate events that, at first sight, might not seem to have any connection. The cross-domain functionality also increases productivity by reducing the amount of overlap between operators responsible for monitoring different technical areas. For example, by correlating events relating to database problems, network problems, and storage problems, you can avoid the scenario of operators from the different technical areas all separately investigating different events that are the symptoms of one root cause event.
TBEC offers a number of benefits related to resolving complex events:
- Reduces the number of events displayed in the console, but without ignoring or losing important data that enables users to drill down through the hierarchy of related events.
- Supports event correlation across multiple domains to simplify root-cause analysis of events that generate symptom events.
- Changes to topological data do not require changes to correlation rules.
Event storm suppression
If a problem is experienced on a managed system that results in the generation of an abnormally high number of events within a relatively short period of time, this phenomenon is known as an event storm. It is very probable that the root cause is already known and is being addressed. However, related events are also being generated. These events do not provide any useful information but may result in significantly increased loads on the servers. To avoid this situation, OMi can be configured to look for event storms from managed systems and discard all subsequent events until the event storm condition for a particular system is over.
An event storm is detected when the number of events received within the detection time period, as a result of a problem on a system, exceeds the configured threshold required to enter an event storm condition.
When an event storm is detected on a system, events from this system are discarded until the rate of incoming events drops below the event storm end threshold. You can configure exception rules to select events from a system under event storm conditions that match a filter and either display these events in the Event Browser or close them (available in the Event Browser under Closed Event). The event storm end event automatically closes the associated event storm begin event.