Searching the Help
To search for information in the Help, type a word or phrase in the Search box. When you enter a group of words, OR is inferred. You can use Boolean operators to refine your search.
Results returned are case insensitive. However, results ranking takes case into account and assigns higher scores to case matches. Therefore, a search for "cats" followed by a search for "Cats" would return the same number of Help topics, but the order in which the topics are listed would be different.
| Search for | Example | Results |
|---|---|---|
| A single word | cat
|
Topics that contain the word "cat". You will also find its grammatical variations, such as "cats". |
|
A phrase. You can specify that the search results contain a specific phrase. |
"cat food" (quotation marks) |
Topics that contain the literal phrase "cat food" and all its grammatical variations. Without the quotation marks, the query is equivalent to specifying an OR operator, which finds topics with one of the individual words instead of the phrase. |
| Search for | Operator | Example |
|---|---|---|
|
Two or more words in the same topic |
|
|
| Either word in a topic |
|
|
| Topics that do not contain a specific word or phrase |
|
|
| Topics that contain one string and do not contain another | ^ (caret) |
cat ^ mouse
|
| A combination of search types | ( ) parentheses |
|
Performance Dashboard and Performance Engine
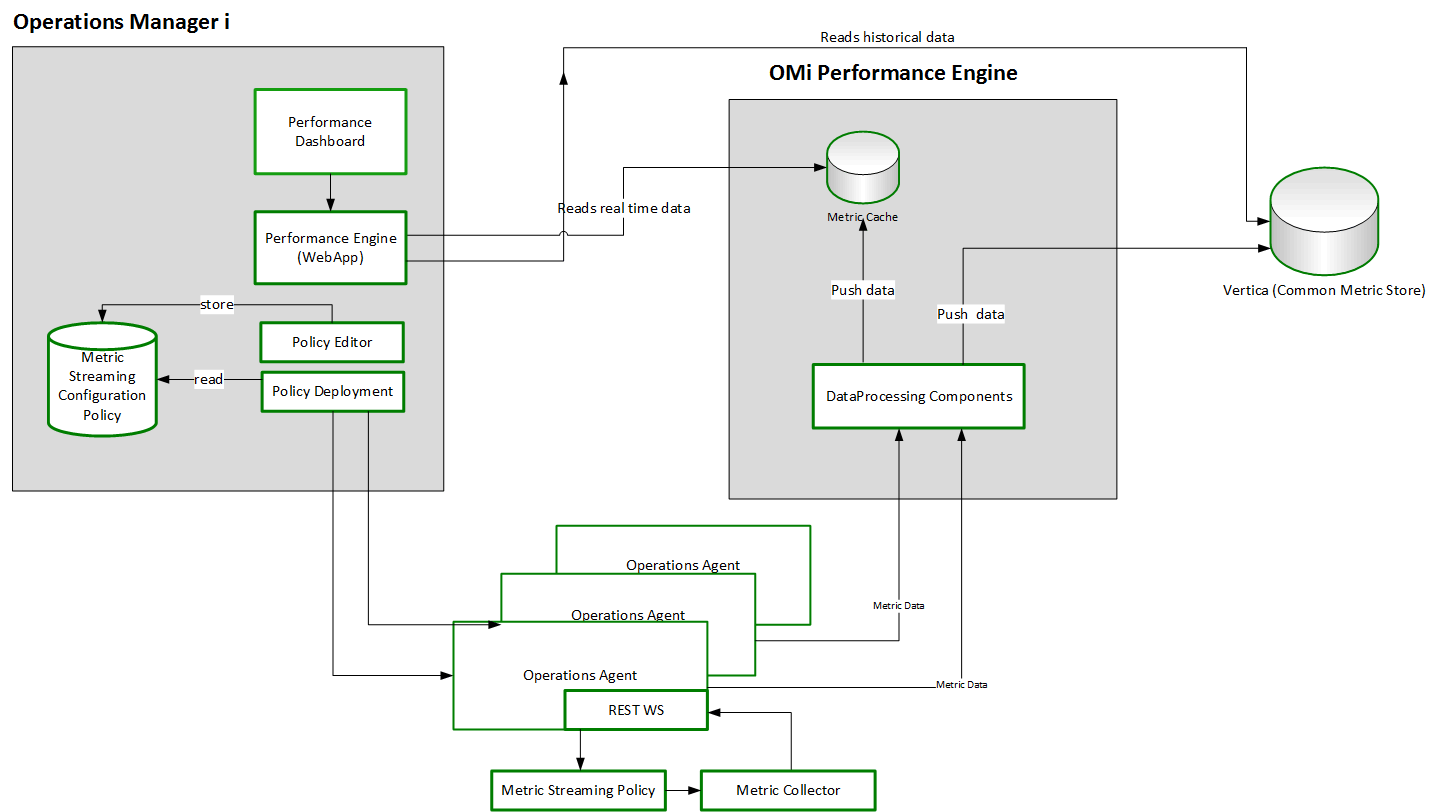
The Performance Dashboard in OMi enables you to visualize system metrics and custom application metrics in the form of performance dashboards. You can use out-of-the-box dashboards, as well as create custom performance dashboards for the Configuration Items (CIs) that you are monitoring. OMi Performance Dashboard works with the following data sources to visualize performance metrics as dashboards:
- Operations Agent
- SiteScope
- Operations Connector
- OpsBridge Store (provided by OMi Performance Engine)
- Application Performance Management (APM)
- Cloud Optimizer
The Performance Engine is an add-on component of Operations Manager i that provides streaming of custom metrics and system metrics in a large scale environment. OMi Performance Engine aggregates streamed data from Operations Agent or Operations Connector which receive data using the RTCM-REST Web Service interface. OMi Management Packs also use the Operations Agent REST WebService interface to submit metrics data for metric streaming. You can visualize the metric data in the OMi Performance Dashboard by using the OpsBridgeStore data source. OMi Performance Engine stores 720 points of data for a metric. If the collection and forwarding interval is configured for 5 seconds, the cache will hold 1 hour of data. The metric data is stored for one hour and can be displayed as real-time data in the OMi Performance Dashboard. If a Vertica database is installed and configured, you can also store metrics for longer than an hour and display them in the OMi Performance Dashboard.

OMi Performance Dashboard and OMi Performance Engine provide the following capabilities for users:
- Visualize, investigate, and review the performance of specific system infrastructure metrics as well as custom application metrics in real-time.
- Aggregate and stream custom metric data and system metric data for more than 25000 datapoints/sec from managed nodes.
- OMi Performance Engine can be installed separately on an additional server to support additional real-time data sources and thus provides a scalable environment.
- Share existing Vertica database available with OpsBridge Reporter for additional data retention for more than one hour.
We welcome your comments!
To open the configured email client on this computer, open an email window.
Otherwise, copy the information below to a web mail client, and send this email to ovdoc-asm@hpe.com.
Help Topic ID:
Product:
Topic Title:
Feedback:


