Searching the Help
To search for information in the Help, type a word or phrase in the Search box. When you enter a group of words, OR is inferred. You can use Boolean operators to refine your search.
Results returned are case insensitive. However, results ranking takes case into account and assigns higher scores to case matches. Therefore, a search for "cats" followed by a search for "Cats" would return the same number of Help topics, but the order in which the topics are listed would be different.
| Search for | Example | Results |
|---|---|---|
| A single word | cat
|
Topics that contain the word "cat". You will also find its grammatical variations, such as "cats". |
|
A phrase. You can specify that the search results contain a specific phrase. |
"cat food" (quotation marks) |
Topics that contain the literal phrase "cat food" and all its grammatical variations. Without the quotation marks, the query is equivalent to specifying an OR operator, which finds topics with one of the individual words instead of the phrase. |
| Search for | Operator | Example |
|---|---|---|
|
Two or more words in the same topic |
|
|
| Either word in a topic |
|
|
| Topics that do not contain a specific word or phrase |
|
|
| Topics that contain one string and do not contain another | ^ (caret) |
cat ^ mouse
|
| A combination of search types | ( ) parentheses |
|
Data Flow Probe Details Pane
| To access | Select Data Flow Probe Setup > Domains and Probes pane > Domains and Probes root node > a domain > Data Flow Probes > a Data Flow Probe. |
| Relevant tasks | Add a Data Flow Probe |
| See also | Data Flow Probe Status |
Displays the details of the selected Data Flow Probe.
User interface elements are described below:
| UI Element (A–Z) | Description |
|---|---|
| Default Tenant |
Displays the default tenant for the Data Flow Probe. Note When working in multi-tenancy mode, the best practice is for all Data Flow Probes in a probe cluster to have the same default tenant defined for them. If Data Flow Probes have different default tenants and a re-distribution of the ranges occurs, the tenant of the already discovered CIs is not changed. Available: In multi-tenancy environments only. |
| Last time probe accessed UCMDB | The last time that the Probe accessed the server machine. |
| Probe Description |
The description given to the Probe when it was added to RTSM. Note This field is editable. |
| Probe IPs |
The IPs of the Probe machine. Note If the Probe machine has more than one network card, all the IP addresses are displayed. |
| Status |
The status of the selected Probe:
Note When the Probe is suspended, (suspended) is also displayed together with the status. |
| Version |
The version of the Probe. Note If the version of the Probe is not compatible with the version of the RTSM server, this is indicated. Moreover, if the incompatible Probe tries to connect to the RTSM server, the server sends a shutdown instruction to the Probe. To ensure compatibility:
|
Enables you to define network IP addresses on which a Probe must discover CIs.
| Important Information |
|
User interface elements are described below:
| UI Element (A–Z) | Description |
|---|---|

|
New IP Range. Opens the New IP Range dialog box, enabling you to define a new IP range for the selected Probe. For details, see New/Edit Range Dialog Box. |

|
Delete IP Range. Select an IP range and click the button to delete a range from the list. Note You can also delete an excluded IP range. |

|
Edit IP Range. Opens the Edit IP Range dialog box, enabling you to edit the selected IP range for the selected Probe. For details, see New/Edit Range Dialog Box. Note You can also edit an excluded IP range. |

|
Export Data To File. Enables you to export the defined ranges in the following formats:
Tip To extract HTML code from the report:
Note Ranges in CIDR notation can also be exported. |

|
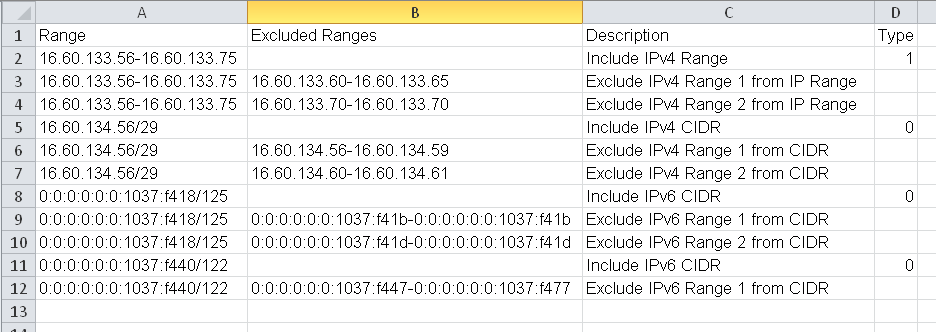
Import Ranges from CSV File. Opens the Import Ranges from File dialog box, enabling you to select a CSV file from which to import a set of ranges. Before importing ranges, verify that:
|

|
Expand All. Expands the entire hierarchical tree structure to display all of the defined IP ranges, including the excluded IP ranges. |

|
Collapse All. Collapses the hierarchical tree structure, leaving the top-level IP ranges showing, but hiding excluded IP ranges. |

|
Show/Hide Legend. Shows/Hides the legend for the Ranges pane.
|
| <Ranges grid> | The network range where the Probe discovers CIs. For details, see New/Edit Range Dialog Box. |
We welcome your comments!
To open the configured email client on this computer, open an email window.
Otherwise, copy the information below to a web mail client, and send this email to ovdoc-asm@hpe.com.
Help Topic ID:
Product:
Topic Title:
Feedback:


 . Denotes the range of IP addresses included for the selected Probe.
 . Denotes a range of IP addresses to exclude from the defined IP range.