Searching the Help
To search for information in the Help, type a word or phrase in the Search box. When you enter a group of words, OR is inferred. You can use Boolean operators to refine your search.
Results returned are case insensitive. However, results ranking takes case into account and assigns higher scores to case matches. Therefore, a search for "cats" followed by a search for "Cats" would return the same number of Help topics, but the order in which the topics are listed would be different.
Search for | Example | Results |
---|---|---|
A single word | cat
|
Topics that contain the word "cat". You will also find its grammatical variations, such as "cats". |
A phrase. You can specify that the search results contain a specific phrase. |
"cat food" (quotation marks) |
Topics that contain the literal phrase "cat food" and all its grammatical variations. Without the quotation marks, the query is equivalent to specifying an OR operator, which finds topics with one of the individual words instead of the phrase. |
Search for | Operator | Example |
---|---|---|
Two or more words in the same topic |
|
|
Either word in a topic |
|
|
Topics that do not contain a specific word or phrase |
|
|
Topics that contain one string and do not contain another | ^ (caret) |
cat ^ mouse
|
A combination of search types | ( ) parentheses |
|
Editing Charts
You can use this option to edit charts. The settings for each chart is described in detail. The common and specific settings for each chart are described in this section.
Click the title of the chart and click Edit.
The following settings are available for each chart:
Settings | Graph | Single Value | Pie | Table |
---|---|---|---|---|
Metrics |
|
|||
Axis and Grid | ||||
Display Styles | ||||
Options | ||||
Styles | ||||
Link |
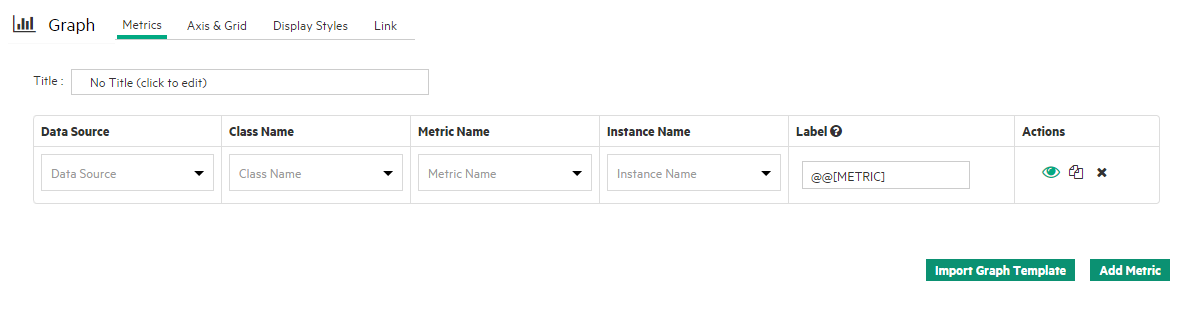
You can use this tab to specify the metric attributes for the charts. This tab is available for all charts.
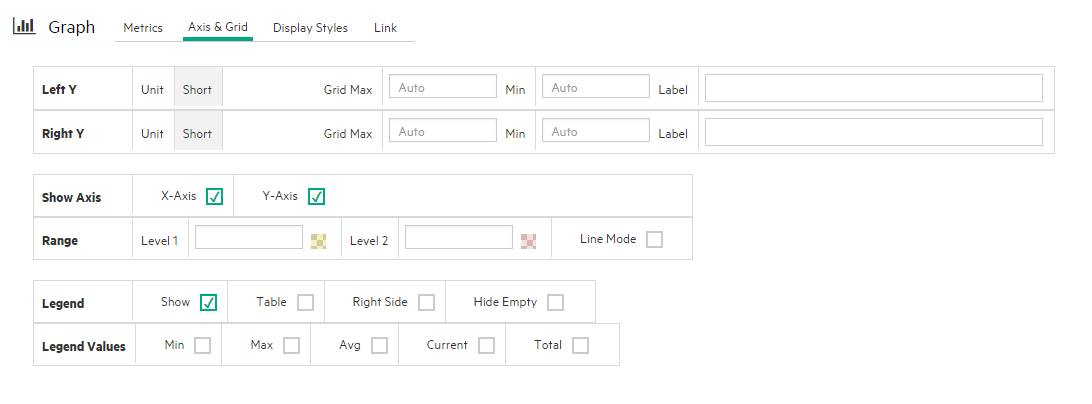
You can use this tab to specify the axis and grid attributes for the charts. Mouse over the image and click an area for a brief summary of that area.
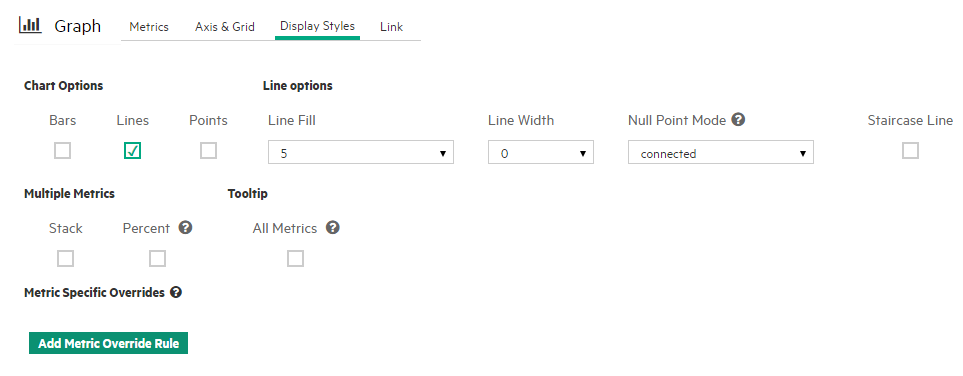
You can use this tab to specify the display styles for the charts. Mouse over the image and click an area for a brief summary of that area.
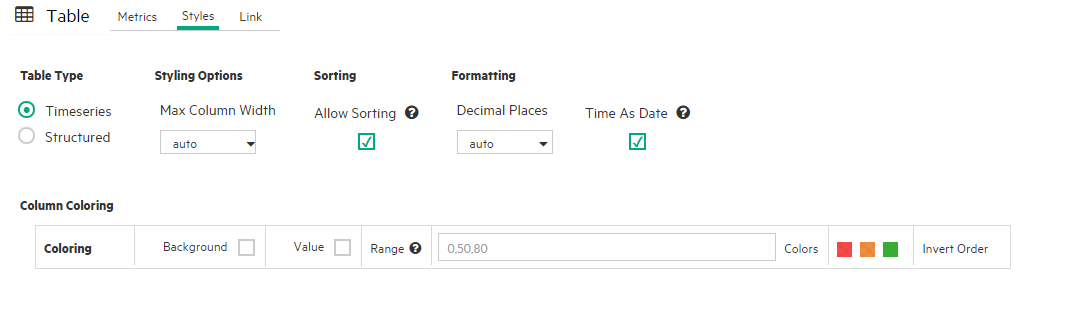
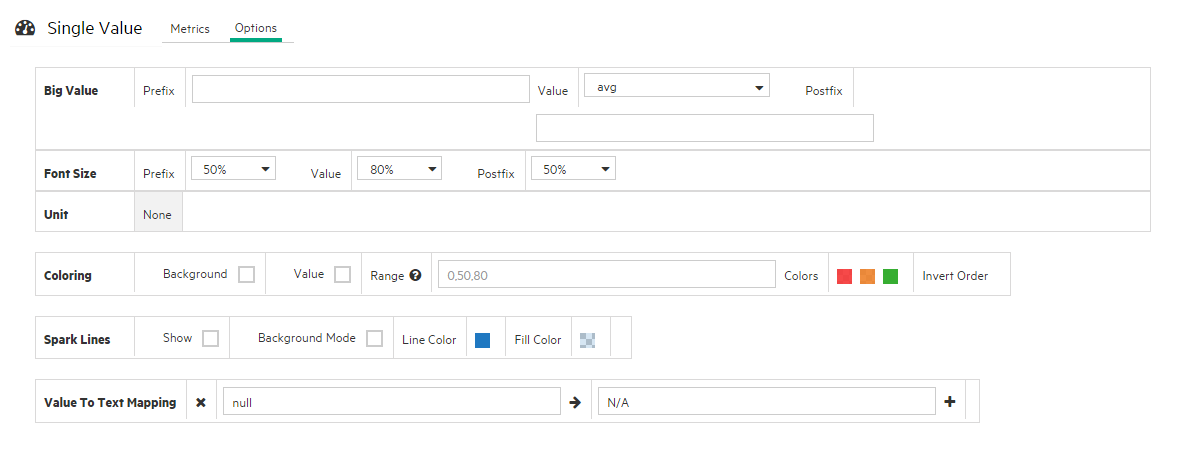
You can use this tab to specify the font and coloring options for the charts. Mouse over the image and click an area for a brief summary of that area.
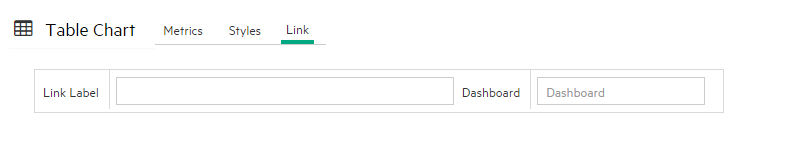
You can use this option to link the chart to a dashboard.
You can use this tab to specify the table attributes. This option appears only for tables. Mouse over the image and click an area for a brief summary of that area.
We welcome your comments!
To open the configured email client on this computer, open an email window.
Otherwise, copy the information below to a web mail client, and send this email to ovdoc-asm@hpe.com.
Help Topic ID:
Product:
Topic Title:
Feedback: