


In the Performance Perspective tab, OMi Performance Dashboard enables you to visualize performance metrics in the form of performance dashboards. By default, OMi Performance Dashboard comprises out-of-the-box dashboards. In addition, you can also create and customize performance dashboards for the Configuration Items (CIs) that you are monitoring.
OMi Performance Dashboard helps you perform the following:
- Explore and visualize performance metrics of a host of components such as applications, system, and network.
- Quickly visualize the performance of important CIs by using personalized favorites.
- Public Favorites - Support for sharing user-defined favorites as public favorites.
-
Embed charts such as graphs, table, text, process table, and pie into the performance dashboard or copy the URL of any chart and embed it into your My Workspace page.
- Support for URL launch - embed performance dashboards or single charts into any UI mashup page.
-
Instance Parameterization for managing different multiple instances across systems.
-
Event Overlay for visualizing event information in the performance dashboard.
-
Date Range Panel for visualizing time-specific data.
-
Dashboard Assignment for assigning performance dashboards to CI Types (CITs).
-
Real-time visualization of performance metrics.
- Simultaneous display of real-time and historical data.
- Forward critical performance metrics to Business Value Dashboard (BVD).
- CI Comparison dashboard for comparing CIs that belong to similar CITs.
-
Support for OpsBridge store, new data store provided by OMi Performance Engine.
Note OMi Performance Dashboard supports graphing data from multiple connector systems for a certain topology instance. However, for the topology instances that are integrated through Operations Agent, SiteScope, or Cloud Optimizer, OMi Performance Dashboard graphs data from only one system.
OMi Performance Dashboard can be used by Performance Experts - System and Application Administrators - to diagnose specific problems and to troubleshoot server performance.
In the Performance Perspective tab, the following panes help you visualize performance metrics:
-
View Explorer
Displays a list of views and their CI hierarchies. The component enables you to select a view and browse through its CI hierarchy, or to search for a CI in the selected view. For more information, see View Explorer Component.
-
Performance Pane
Enables you to create, customize, and visualize performance dashboards.
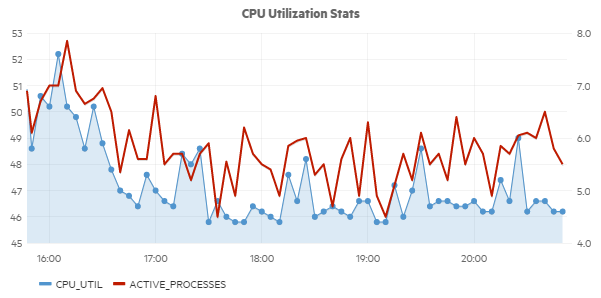
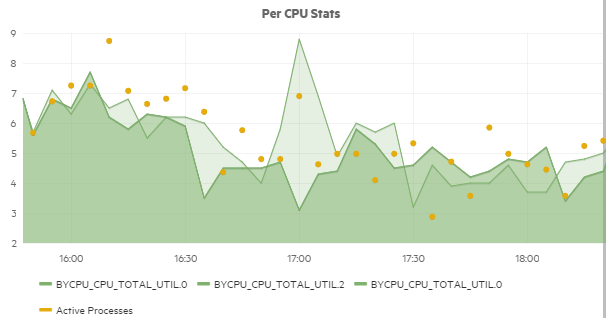
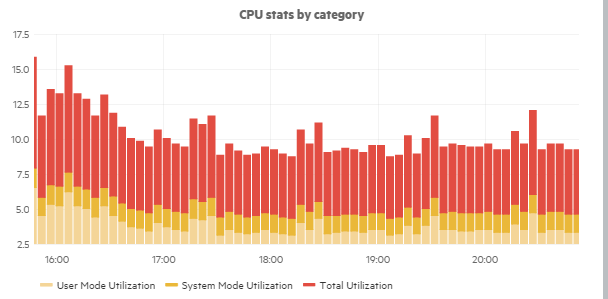
The following slideshow shows how data can be visualized by using the Performance Dashboard.
In this example, the performance metrics - CPU Utilization Statistics, Per CPU Statistics, and CPU Statistics are visualized in the form of a dashboard.
The date formats displayed in the Performance Perspective correspond to the language setting in the web browser. For example, if your browser is set to en-IN (English India), the date is displayed using the Indian date/month/year format, for example 17/7/13.
The following date formats are currently supported:
de-DE - German
en-AU - English Australia
en-GB - English United Kingdom
en-IN - English India
en-US - English United States
en-CA - English Canada
es-ES - Spanish
fr-FR - French
ja-JP - Japanese
ko-KR - Korean
ru-RU - Russian
zh-CN - Chinese China
zh-HK - Traditional Chinese Hong Kong
zh-SG - Simplified Chinese Singapore
If no preferred language is specified, en-US is used.
Note For German or French languages, the date format is always taken from the base language even if you have selected a regional setting in your web browser.
For example, if you have selected fr-BE for the regional setting in your web browser, the date format is taken from the fr-FR setting.