


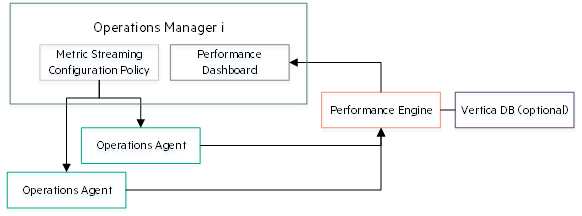
Metric Streaming Configuration policies define metrics that are collected by an Operations Agent or an Operations Connector in a high frequency interval. These metrics are then forwarded to an endpoint of your choice, enabling you to display, in real time, critical application metrics that need to be checked frequently.
You can, for example, forward metrics data to an OMi Performance Engine server. The Performance Engine then forwards this data to the Performance Dashboard where the data is displayed.
By using Metric Streaming Configuration policies, you can configure the metric streaming data collection.
-
Open the Policy Templates manager:
Administration > Monitoring > Policy Templates
Alternatively, click Policy Templates.
-
In the Policy Template Groups pane, select Policy Management > Templates grouped by type > Configuration.
-
Click the Metric Streaming Configuration folder, and then do one of the following:
-
Add a new policy template: in the Policy Templates pane, click
 New Item , and then click the
  Add New Policy Template... or Add New Policy Template (Raw Mode) button.
 -
Edit an existing policy template: in the Policy Templates pane, click
 Edit Item , and then click the Edit Policy Template or Edit Policy Template (Raw Mode) button.
The Metric Streaming Configuration Policy Editor opens.
-
Learn more
Performance Engine is an add-on component of OMi that provides custom application metrics and system metrics streaming in a large-scale environment.
If a Performance Engine server is set as the Target Endpoint, the Performance Engine receives data from the Operations Agent or Operations Connector. The Performance Dashboard is then able to retrieve these metrics and display them in a dashboard.
For more information about Performance Engine, see Performance Dashboard and Performance Engine.
Metric Streaming Configuration policies consist of two parts: the definition and data part. The definition part contains general information about the policy, whereas the data part contains the rules and instructions that configure the instrumentation on the node.
Policy Definition
The definition part of the policy syntax defines the path and file name of the configuration file that is associated with the policy. It contains the following attributes:
-
SyntaxVersion -
Specifies the version of the policy syntax.
-
Application -
Specifies the name of the managed application, for the Metric Streaming Configuration policy this is
rtcm. -
SubGroup -
Additional grouping mechanism that helps to manage configuration files by grouping them according to custom categories.
-
Filename -
Specifies the file name of the configuration file (for example,
config.json).
Policy Data
The data part of the policy syntax contains the rules and instructions that configure the instrumentation on the node. This part begins with the following keyword:
Data:
The following generic keywords can be used after Data:
#$Installcommand=<command>
#$Deinstallcommand=<command>
<command> contains the command to be run, including any required parameters. If necessary, use quotation marks to handle all platforms. $Installcommand runs when the policy is deployed or enabled. $Deinstallcommand runs when the policy is removed or disabled.
After #$Deinstallcommand, the following data is specified (surrounded by { } brackets):
-
SchemaVersion -
Version of the policy (for example
1.0). -
TargetURL -
Specifies the endpoint URL to which the collected metrics data is streamed (for example
https://receiver.endpoint:4141/example). -
RealTimeMetrics -
Lists the metrics data that is forwarded to the endpoint receiver in real time. You can specify the
CollectorName,CollectorExec,Interval,DataSource, and theMetrics. -
CollectorName -
Name of the Operations Agent or Operations Connector that collects the metrics data.
-
CollectorExec -
Specifies how the metric collection is done by the collector, for example which file is executed.
-
Interval -
Interval at which metrics are collected and streamed to the endpoint, for example
5s(5 seconds). -
Metrics -
Lists the metrics that are collected and streamed by the Operations Agent or Operations Connector.
ClassNameThe name of the class to which the metric belongs to. MetricNameThe name of the metric. InstancesLists the instances in a comma-separated list, surrounded by brackets. <*>can be used as a wildcard. For example:"Instances": ["(example)","(<*>.company.com)"]OriginalMetricNameThe original name of the metric.
When you deploy or enable the following example Metric Streaming Configuration policy, the msc.json file is created and install.bat runs. When you remove or disable the policy, the msc.json file is removed and deinstall.bat runs.
The msc collector collects two metrics - metric1 and metric2 - in a five second interval and sends the data to the target endpoint https://example.company:424/test.
Example:
SyntaxVersion=1
Application=rtcm
SubGroup=policies
Filename=msc.json
Data:
#$Installcommand="C:\data\install.bat"
#$Deinstallcommand="C:\data\deinstall.bat"
{
	"SchemaVersion": "1.0",
	"TargetURL": "https://example.company:424/test",
	"RealTimeMetrics": [{
		"CollectorName": "msc",
		"CollectorExec": "msc.exe",
		"DataSource": "msc_rtcm_ds",
		"Interval": "5s",
		"Metrics": [{
			"ClassName": "msc_rtcm_class",
			"MetricName": "metric1",
			"Instances": ["(Record1)","(Record2)"],
			"OriginalMetricName": "metric1_ori"
		},
		{
			"ClassName": "msc_rtcm_class",
			"MetricName": "metric2",
			"Instances": ["(Record1)","(Record2)"],
			"OriginalMetricName": "metric2_ori"
		}]
	}]
}
Tasks
Before you can collect metric streaming data from an Operations Agent or Operations Connector and forward it to an endpoint, complete the following steps:
-
Install and configure Operations Agent version 12.01 or later on the system that lists the metrics. For more information, see the Operations Agent Help.
-
The Operations Agent must allow the collection of real-time metrics so that they can be listed in the Operations Agent policy editor. For details, see How to enable metric streaming on the Operations Agent.
-
If you use metric streaming with a Performance Engine server, install and configure the Performance Engine either on the OMi Linux Gateway server or on a separate Linux server. For more information, see the Install section.
To make the Performance Engine data visible in the Performance Dashboard, specify the Performance Engine Node details in the Infrastructure Settings:
Administration > Setup and Maintenance > Infrastructure Settings > Applications > Performance Engine
Enable the collection of real time metrics on the Operations Agent. Either run the oalicense command on a specific agent – this is recommended if only one agent is used – or add multiple Operations Agents to a profile file during the agent installation or configuration to set the licenses automatically.
Enable collection of real time metrics on one Operations Agent
Windows: %OvInstallDir%\bin\win64\oalicense -set -type PERMANENT “HP Ops OS Inst to Realtime Inst LTU”
Linux: /opt/OV/bin/oalicense -set -type PERMANENT “HP Ops OS Inst to Realtime Inst LTU”
Afterwards, run ovc -restart.
Enable collection of real time metrics on multiple Operations Agents
You can create and use an agent profile file to enable the collection of real-time metrics during the installation or configuration process. To create a profile file for the real-time license, add the following lines to the profile file:
set eaagt.license:HP_Operations_OS_Inst_Adv_SW_LTU=PERMANENT
set eaagt.license:HP_Ops_OS_Inst_to_Realtime_Inst_LTU=PERMANENT
Run the installation or configuration with the agent profile file as input:
-
For the installation:
Windows:
cscript oainstall.vbs –i –a –agent_profile <profile file with full path>Linux:
./oainstall.sh –i –a –agent_profile <profile file with full path> -
For the configuration:
Windows:
%OvInstallDir%\bin\win64\OpC\install\oainstall.vbs –c –a –agent_profile <profile file with full path>Linux:
./oainstall.sh –c –a –agent_profile <profile file with full path>
To create a Metric Streaming Configuration policy, follow these steps:
-
Open the Metric Streaming Configuration Policy Editor. In the Properties section, specify a Display Name for the policy.
Optional. Change the policy version (Version), provide a description of the policy (Description), enter information about the policy changes (Change Log), and select the operating systems with which the policy is compatible (OS Types).
For more information, see Properties Section.
-
In the Metrics section, choose the host name of the Operations Agent or Operations Connector from which you want to collect metrics data. Click Load Metric Definitions to get a list of all available metrics associated with that agent or connector. From the displayed list, select the metrics you want to include in the policy. If you want to remove all unselected metrics from the list, click Remove Unselected. Unselected metrics and instances are excluded from the policy.
You can repeat this step to include metrics from different agents.Optional. Click
 Add Child next to Metrics to add another data source. Enter the following information:
Data Source Name of the data source from which the metrics data is collected. Collector Optional. Name of the Operations Agent or Operations Connector that collects the metrics data. Collector Executable Optional. Specifies how the metric collection is done by the collector (for example which file is executed). Collection Interval Interval (in minutes or seconds) at which metrics are collected and streamed to the endpoint. Metric Class Name of the class to which the metric belongs. Original Metric Name Optional. Original name of the metric when retrieved by a third party domain manager. Instances Include either all instances or specific instances. Metric Name Name of the metric. Optional. Click
on the metric class level to add an instance of the metric. -
In the Target Endpoint section, specify the endpoint URL to which the metrics data will be streamed.
Note If you have correctly set up a Performance Engine, the URL is automatically retrieved from the Performance Engine server.
Specify the endpoint URL in the following format:
http(s)://<Hostname>:<Port>/<Path><Hostname>
Fully Qualified Domain Name (FQDN) of the endpoint server.<Port>
Port used to access the endpoint server.<Path>
Specify the complete path to the endpoint.Example:
https://receiver.endpoint:4141/example -
Click Save and Close to save the policy template and exit the editor.
UI Reference
To access the Policy Template Editor, click ![]() New Item >
New Item >![]() Add New Policy Template... in the Metric Streaming Configuration folder.
Add New Policy Template... in the Metric Streaming Configuration folder.
|
Description |
|
|---|---|
| Display Name |
Name of the policy. You can use spaces in the name. The equal sign (=) is not allowed. |
| Description | Description of what the policy does. You can also add other notes (for example, data sources that are used). |
| Template ID | |
| Version ID | |
| Version |
Current version of the policy. If you modify an existing policy, you create a new version of the policy in the database with a unique version number. By default, the minor version number increases by one after you modify the policy and save it. If you want to save the policy with a specific version number, you can select the major or minor version number that you want. It is not possible to replace an existing version of a policy. However, you can delete a specific version of a policy. Note If you modify a policy template that is part of an HPE Operations Manager i Management Pack, increase only the minor version number. The next version of the Management Pack usually uses the next major version number. |
| Change Log |
Text that describes what is new or modified in this version of the policy. |
|
Last Modification |
The date and time is displayed according to the current time zone of the computer on which the web browser runs. The language setting of the web browser determines the date and time format (for example, |
| Last Modified by |
Name of the user that was active when the policy was saved. |
| OS Types |
Types of operating system with which this policy is compatible. To enable platform neutrality, you can create several platform-specific variations of the same policy, and include them all in one aspect. OMi ensures that a policy is deployed only to host nodes that have the operating systems that you specify. If you leave all the OS type check boxes clear, the policy can be deployed to host nodes with any operating system. |
|
UI Element |
Description |
|---|---|
|
|
Add a new data source and specify the name of the data source, the collection interval, the metric class, the instances, and the metric name. |
| Agent Hostname |
Name of the Operations Agent or Operations Connector (OpsCx) from which metric definitions are retrieved to create the policy template. Nothing is sent to this Operations Agent or Operations Connector. |
| Load Metric Definitions | Click to load all metric classes associated with the chosen agent or OpsCx. |
| Remove Unselected | Unselected metric definitions are excluded from the Metric Streaming Configuration policy. Click Remove Unselected to visualize the outcome of the policy. |
| Expand All |
Expand all metric groups to view all available metrics. The following hierarchy is displayed:
A metric that is created in this tree structure is used only for the creation of the policy. It is not visible in the agent or Operations Connector. |
|
UI Element |
Description |
|---|---|
| Target Endpoint |
Specify the endpoint URL to which the collected metrics data is streamed in the following format:
Example: |
To access the Policy Template Editor, click ![]() New Item >
New Item >![]() Add New Policy Template (Raw Mode) in the Metric Streaming Configuration folder.
Add New Policy Template (Raw Mode) in the Metric Streaming Configuration folder.
|
Description |
|
|---|---|
| Name |
Name of the policy. You can use spaces in the name. The equal sign (=) is not allowed. |
| Description | Description of what the policy does. You can also add other notes (for example, data sources that are used). |
| Template ID | |
| Version ID | |
| Version |
The current version of the policy. If you modify an existing policy, you create a new version of the policy in the database with a unique version number. By default, the minor version number increases by one automatically after you modify the policy and save it. If you want to save the policy with a specific version number, you can select the major or minor version number that you want. It is not possible to replace an existing version of a policy. However, you can delete a specific version of a policy. Note If you modify a policy template that is part of an HPE Operations Manager i Management Pack, increase only the minor version number. The next version of the Management Pack usually uses the next major version number. |
| Change Log |
Text that describes what is new or modified in this version of the policy. |
|
Last Modification |
The date and time displays using the current time zone of the computer on which the web browser runs. The language setting of the web browser determines the date and time format (for example, |
| Last Modified by |
Name of the user active when the policy was saved. |
| OS Types |
Types of operating system with which this policy is compatible. To enable platform neutrality, you can create several platform specific variations of the same policy, and include them all in one aspect. OMi ensures that a policy is deployed only to host nodes that have the operating systems that you specify. If you leave all the OS type check boxes clear, the policy can be deployed to host nodes with any operating system. |
|
Description |
|
|---|---|

|
Load From Local File System: Click to open the Select file to upload dialog box. Use the dialog box to upload a policy file. Policy files are data files and their file names end in |

|
Save To Local File System:. Click to download the policy to a policy data file on your system. You can then update the policy in an editor of your choice. After completing your changes to the policy, upload the policy data file by clicking the The policy editor automatically asks you to download policies that exceed 1 MB in file size. |

|
Check Syntax. Metric Streaming Configuration policies do not support syntax checking. |
| <policy data> |
Policy data in text form. The policy editor highlights the policy syntax. If the policy exceeds 1,000 lines, syntax highlighting is automatically disabled. If the policy exceeds 1 MB in file size, the policy editor automatically asks you to download the policy to a file. For details, see Metric streaming configuration policy syntax. |