
Searching the Help
To search for information in the Help, type a word or phrase in the Search box. When you enter a group of words, OR is inferred. You can use Boolean operators to refine your search.
Results returned are case insensitive. However, results ranking takes case into account and assigns higher scores to case matches. Therefore, a search for "cats" followed by a search for "Cats" would return the same number of Help topics, but the order in which the topics are listed would be different.
| Search for | Example | Results |
|---|---|---|
| A single word | cat
|
Topics that contain the word "cat". You will also find its grammatical variations, such as "cats". |
|
A phrase. You can specify that the search results contain a specific phrase. |
"cat food" (quotation marks) |
Topics that contain the literal phrase "cat food" and all its grammatical variations. Without the quotation marks, the query is equivalent to specifying an OR operator, which finds topics with one of the individual words instead of the phrase. |
| Search for | Operator | Example |
|---|---|---|
|
Two or more words in the same topic |
|
|
| Either word in a topic |
|
|
| Topics that do not contain a specific word or phrase |
|
|
| Topics that contain one string and do not contain another | ^ (caret) |
cat ^ mouse
|
| A combination of search types | ( ) parentheses |
|


![]()
![]()

- Create the Dashboard Contents in the Studio
- About Templates
- Scorecard Template
- Perspective Templates
- Objective Templates
- KPI Templates
- Metric Templates
- Folders
- Activate Scorecards, Perspectives, Objectives, Metrics, and KPIs Templates
- Create Active Scorecards, Perspectives, Objectives, Metrics, or KPIs
- Scorecard Configuration Details
- Perspective Configuration Details
- Objective Configuration Details
- Objective KPIs
- Delete a Node
- KPI and Metric Formula and Filter, Threshold, Value, Trend, and Score
- KPI or Metric Configuration and Calculation Details
- KPI or Metric Formula
- KPI or Metric Filter
- KPI or Metric Business Context
- Calculation
- Recalculation
- Calculation Scheduling
- Calculation and Recalculation Monitoring
- Synchronization of Changes in the Studio with Display in the Dashboard and the Explorer tab
KPI and Metric Formulas, Filter, Threshold, Value, Trend, Score, and Decimal Precision
This section describes the information related to a KPI or Metric:
 Key Performance Indicators (KPIs) and Metrics
Key Performance Indicators (KPIs) and Metrics reflect and measure key drivers of business value. Value drivers represent activities that, when executed properly, guarantee future success. Value drivers move the organization in the right direction to achieve its stated financial and organizational goals.
Example Value drivers might be “high customer satisfaction” or “excellent product quality.”
![]() Additional information about KPIs and Metrics
Additional information about KPIs and Metrics
A KPI is a Metric, but a Metric is not always a KPI. The key difference is that KPIs always reflect strategic value drivers whereas Metrics represent the measurement of any business activity. Metrics always show a number that reflects performance. KPIs put that performance in context. Metrics are not matched against a threshold.
KPIs reflect how well the organization is doing in areas that most impact financial measures valued by shareholders, such as profitability and revenues.
A KPI evaluates the performance according to expectations. The context is provided using:
- Thresholds. Upper and lower ranges of acceptable performance.
- Targets. Predefined gains, such as 10% new customers per quarter.
- Benchmarks. Based on industry wide measures or various methodologies, such as Six Sigma.
- Trends. The direction of the performance of the KPI, either “up,” “down,” or “static.”
Note All the values and thresholds of the Studio KPIs depend on their definition in the Configuration details and Calculation details tabs. You can modify the definitions.
Example A metric could be an MTTR (mean time to recover) which measures the average time between the occurrence of a set of incidents and their resolution. An example of a KPI could be an MTTR, which measures the average time between the occurrence of a set of incidents and their resolution, compared to a defined threshold. For example:‘MTTR less than one hour’.
KPIs measure key drivers of business values using a formula.
KPI templates (out of the box) help you create new KPIs by activating the KPI templates. Metric templates (out-of-the-box) help you create new Metrics by activating the Metric templates.
A complete list of KPIs and Metrics is available in KPI Library in Excel format.
KPI Formula, Filter, and Value
The Scorecard KPI engine calculates the value of the KPI using the formula specified for the KPI and provides the KPI's status and score using the thresholds specified for the KPI. You can also build KPI filters to restrict the range of the formula by selecting specific values for the variables used in the formula.
KPI Threshold
The engine compares the KPI value to the KPI threshold, and calculates the KPI status.
KPI Status
The KPI status can be Error, Warning, or Good.
KPI Trend
The trend shows the tendency of a changing KPI result value relative to the previous result.
The trend is:
- Up if the current result is higher than the previous result.
- Down if the current result is lower than the previous result.
- Neutral if the current and previous results are the same.
KPI Score
The KPI value is translated into a score using the threshold specified for the KPI.
All the scores are normalized to the same scale of measurement (for example from 0 to 10) to enable the calculation of an Objective that is based on the scores of KPI’s from different types. The score reflects the status of the business value and its relative distance from the threshold.
In addition:
- All the parent child rule calculations are based on the scores of their children.
- The KPI score represents how well the KPI is doing compared to the business Objective. For details, see Objectives.Example A KPI calculates a percentage (%) and its thresholds are Good from 90% and up. When the KPI has a value of 90%-100%, the KPI's status is Good. The score for 85% is higher than the score for 65%, and the score for 97% is higher than the score for 93% even though the status is the same, this enables showing the trend of KPIs and Objectives even if the status remains the same.
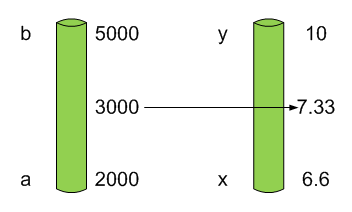
The normalization process is based on the user-defined threshold for a metric. KPI thresholds have 3 sectors: good (6.6 - 10), warning (3.3 - 6.6), and error score ranges (0 - 3.3).
The Score calculation process is as follows:
- Get the KPI result.
- Get the status range as configured by the thresholds in the KPI definition.
- Calculate the score as follows:
F(n) = ((n - a) / (b - a)) * (y - x) + x
where:a – minimal value of the threshold range
b – maximal value of the threshold range
x – minimal value of according score range
y – maximal value of according score range
n – result value
Example If a=2000 and b=5000, the Score value is 7.33
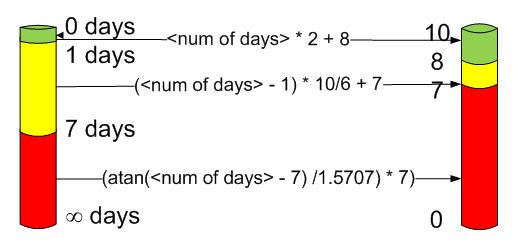
Example The threshold of a metric similar to MTTR (time to fix a problem) is 1 day for good status, and 7 days for warning status. The score scale is constant: 8-10 is good status, 7-8 is the warning status and 0-7 is error status.
Any value on the MTTR scale needs to be transformed into the score scale by linear or exponential transform.Since the lower threshold is not set (it is equal to ∞), the formula is different:
Lets check the Score based on the following Results :
0.5 day F(1) = ((0.5 - 0) / (1 - 0)) * (10 - 8) + 8 = 9 (the score is 9 )
4 days F(4) = ((4 - 1) / (7 - 1)) * (8 - 7) + 7 = 7.5 (the score is 7.5 )
10 days F(10) = (atan(10 - 7) / 1.5707) )* (7-0) = 4.43 (the score is 4.43)
Metric Formula and Value
The Scorecard KPI engine calculates the value of the Metric using the formula specified for the Metric. You can also build metric filters to restrict the range of the formula by selecting specific values for the variables used in the formula.
Decimal Precision
The decimal precision used in displays in ITBA is as follows:
-
Studio/Dashboard/Explorer. By default, the values of KPIs and Metrics are displayed with a maximum of 6 digits (default) (for example: 123456) and if needed a decimal point (123.456).
Digits after the decimal point are rounded to 5 digits maximum by default. For example: 4.567893 is rounded to 4.56789.
Digits before the decimal point are rounded to 3 digits maximum. If there are more than 3 digits before the decimal point, K, M, or T are used to indicate the correct value. For example: 3300122.111 is displayed as 3.300 M, and 999999 is displayed as 999.999 K.
-
Thresholds in Studio.
Because the threshold fields in the Studio are where you enter the threshold values, the thresholds display all the digits before the decimal point. Nevertheless, if you configure a KPI threshold with more than 3 digits after the decimal point, they are rounded to 3 digits. For example:

The Administrator can change the default using one of the following options:
- in Admin > Settings > Dashboard Settings, you can specify a total number of digits (up to 6) in the Total number of digits displayed for KPI/Metric results setting. Note that the number of digits before the decimal point is always 3 with a K, M, or T indication when needed.
-
in Admin > Settings > Dashboard Settings, you can specify the number of digits (up to 5) after the decimal point in the Max number of digits after decimal point setting.
Note that the two settings must work together. The Total number of digits displayed for KPI/Metric results setting decides the total number of digits that is displayed while the Max number of digits after decimal point setting provides the number of digits that is displayed after the decimal point depending on the number of digits of the number.
Settings Number 123.123456 1.123456 12345.123456 Total number of digits displayed for KPI/Metric results = 6
Max number of digits after decimal point = 5
123.123 1.12345 12.3451 K Total number of digits displayed for KPI/Metric results = 3
Max number of digits after decimal point = 5
123 1.12 12.3 K Total number of digits displayed for KPI/Metric results = 6
Max number of digits after decimal point = 2
123.12 1.12 12.34 K
For details, see Settings - Dashboard Settings
We welcome your comments!
To open the configured email client on this computer, open an email window.
Otherwise, copy the information below to a web mail client, and send this email to SW-Doc@hpe.com.
Help Topic ID:
Product:
Topic Title:
Feedback: