
Searching the Help
To search for information in the Help, type a word or phrase in the Search box. When you enter a group of words, OR is inferred. You can use Boolean operators to refine your search.
Results returned are case insensitive. However, results ranking takes case into account and assigns higher scores to case matches. Therefore, a search for "cats" followed by a search for "Cats" would return the same number of Help topics, but the order in which the topics are listed would be different.
| Search for | Example | Results |
|---|---|---|
| A single word | cat
|
Topics that contain the word "cat". You will also find its grammatical variations, such as "cats". |
|
A phrase. You can specify that the search results contain a specific phrase. |
"cat food" (quotation marks) |
Topics that contain the literal phrase "cat food" and all its grammatical variations. Without the quotation marks, the query is equivalent to specifying an OR operator, which finds topics with one of the individual words instead of the phrase. |
| Search for | Operator | Example |
|---|---|---|
|
Two or more words in the same topic |
|
|
| Either word in a topic |
|
|
| Topics that do not contain a specific word or phrase |
|
|
| Topics that contain one string and do not contain another | ^ (caret) |
cat ^ mouse
|
| A combination of search types | ( ) parentheses |
|


![]()
![]()

- Create the Dashboard Contents in the Studio
- About Templates
- Scorecard Template
- Perspective Templates
- Objective Templates
- KPI Templates
- Metric Templates
- Folders
- Activate Scorecards, Perspectives, Objectives, Metrics, and KPIs Templates
- Create Active Scorecards, Perspectives, Objectives, Metrics, or KPIs
- Scorecard Configuration Details
- Perspective Configuration Details
- Objective Configuration Details
- Objective KPIs
- Delete a Node
- KPI and Metric Formula and Filter, Threshold, Value, Trend, and Score
- KPI or Metric Configuration and Calculation Details
- KPI or Metric Formula
- KPI or Metric Filter
- KPI or Metric Business Context
- Calculation
- Recalculation
- Calculation Scheduling
- Calculation and Recalculation Monitoring
- Synchronization of Changes in the Studio with Display in the Dashboard and the Explorer tab
You can change the existing formula of a KPI or Metric to customize it to the end-user's needs. You can also create a formula to calculate the value of the KPI or Metric .
In addition you can restrict the range of the formula by selecting, in the filter, specific values for the variables used in the formula. For details, see KPI or Metric Filter.
To learn about Shared KPIs, see Shared KPIs.
Click Open Formula Builder in the Calculation Details tab in the Properties pane of a KPI or Metric .

 KPI and Metric Formula and Filter, Threshold, Value, Trend, and Score
For details about KPI and Metric formulas, filter, values, decimal precision, thresholds, status, score, and trend, see KPI and Metric Formulas, Filter, Threshold, Value, Trend, Score, and Decimal Precision.
Important Information
- The KPI or Metric Formula language is not case-sensitive.
- Field values are case-sensitive.
- Formulas include single quotes only for entity field values and string primitives (numbers, characters between double-quotes, and dates).
-
During calculation, formulas are converted into SQL queries that run on the database.
You can use additional variables and entities by creating business contexts using Context Designer. For details, see Semantic Layer - Context Designer
KPI Breakdown Formula Limitation
When you configure the formula of a KPI for which you will set up Breakdowns, make sure that you do not use multiple entities.
Example of a correct formula, the formula uses the same entity for the numerator and denominator
PERCENTAGE_MATH(SUM(CostAmount,CostExpenseType = 'CAPEX' and PERIOD_ENTITY=Period),SUM(CostAmount,CostExpenseType = 'OPEX' and PERIOD_ENTITY=Period),100)
Example of an incorrect formula; the formula uses two different entities for the numerator and denominator and that might cause the Breakdown calculations to be incorrect.
PERCENTAGE_MATH(SUM(CostAmount,CostExpenseType = 'CAPEX' and PERIOD_ENTITY=Period),SUM(Cost,CostExpenseType = 'OPEX' and PERIOD_ENTITY=Period),100)
Impact of changes to configurations in the Studio on the display in Dashboard and the EXPLORER tab
Changes in the STUDIO have impacts on the display in Dashboard and EXPLORER. For details, see Synchronization of Changes in the Studio with Display in the Dashboard and the EXPLORER tab.
Link between Contexts and KPI or Metric Formulas
When you create a Context, you select tables, create links between the tables, and select the relevant columns in the tables to be part of the Context. For details, see Semantic Layer - Context Designer.
When you create a KPI or a Metric you assign them a Context in the Studio. The Context tables become variables that you can use when creating KPI or Metric formulas, and the table columns become the variable entities.
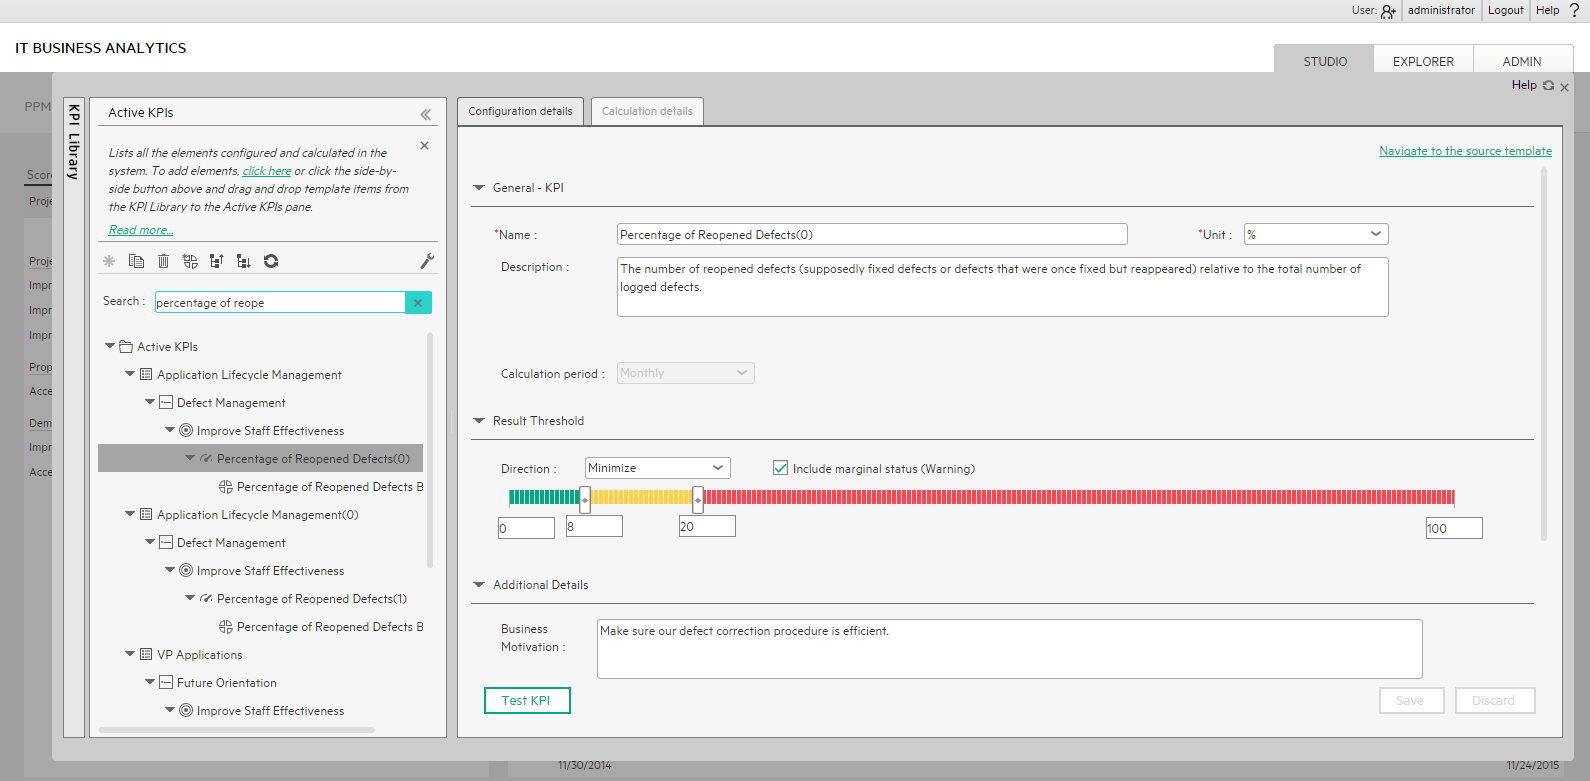
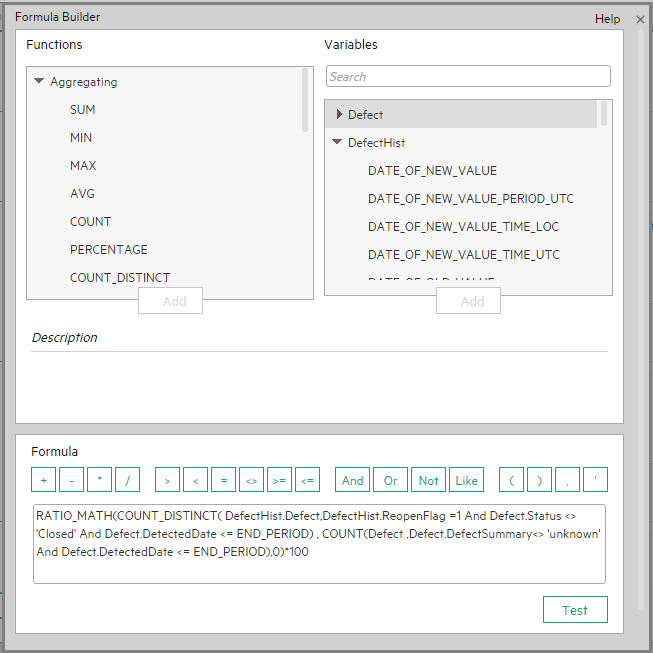
For example the % of Reopened Defects KPI has the following formula:
RATIO_MATH(COUNT_DISTINCT( DefectHist.Defect , DefectHist.ReopenFlag =1 And Defect.Status <> 'Closed') , COUNT( Defect ,Defect.DefectSummary<> 'INVALID' And Defect.DefectSummary<> 'UNKNOWN' ),0)*100
Its definition is:
The Business Context is ALM_Defect. Click Admin > Semantic Layer and open the ALM_Defect Context:
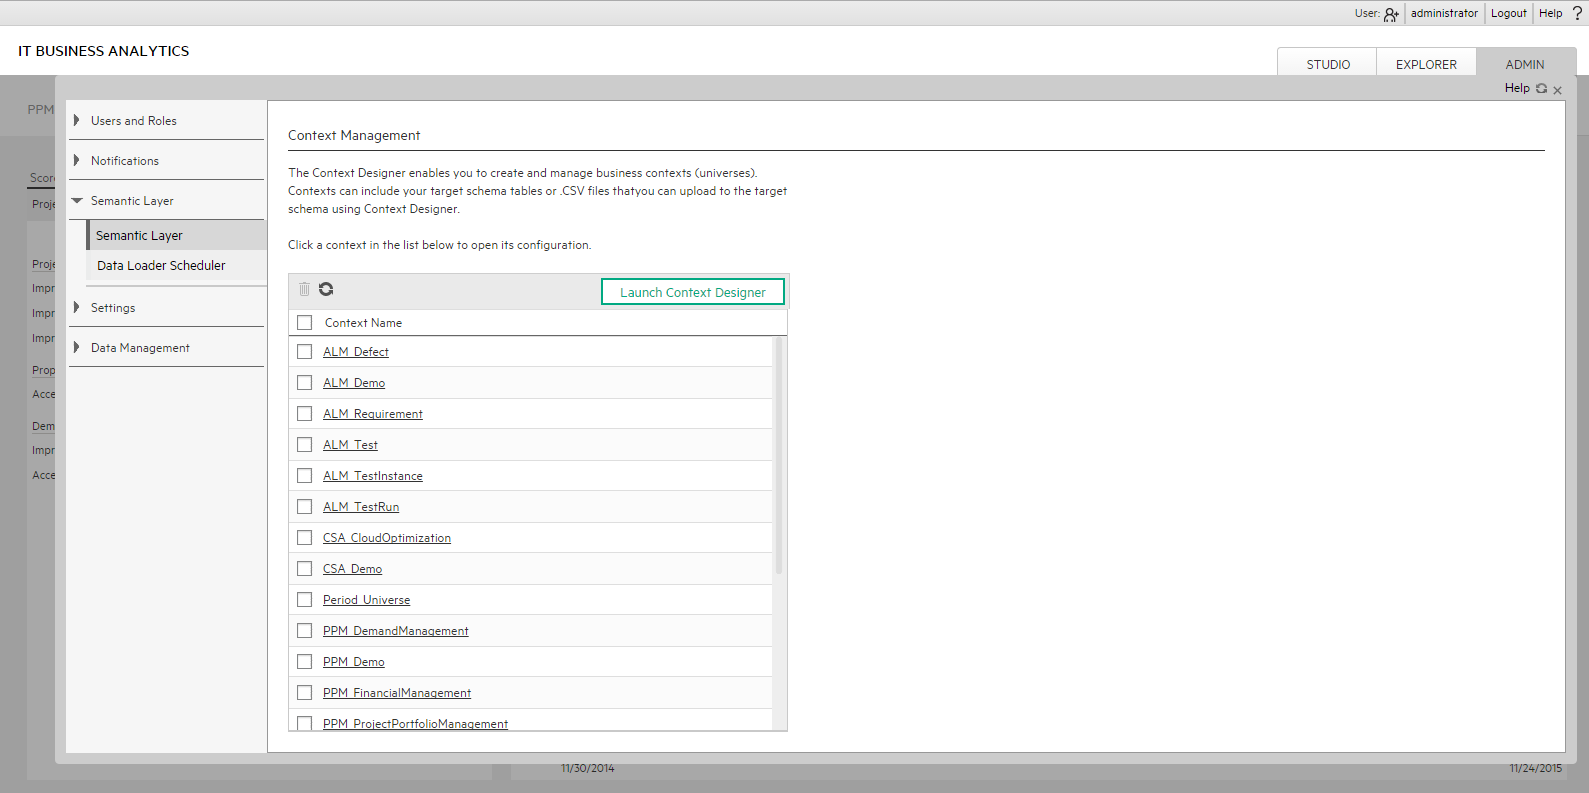
The contents of the Context including the ALM tables is displayed:
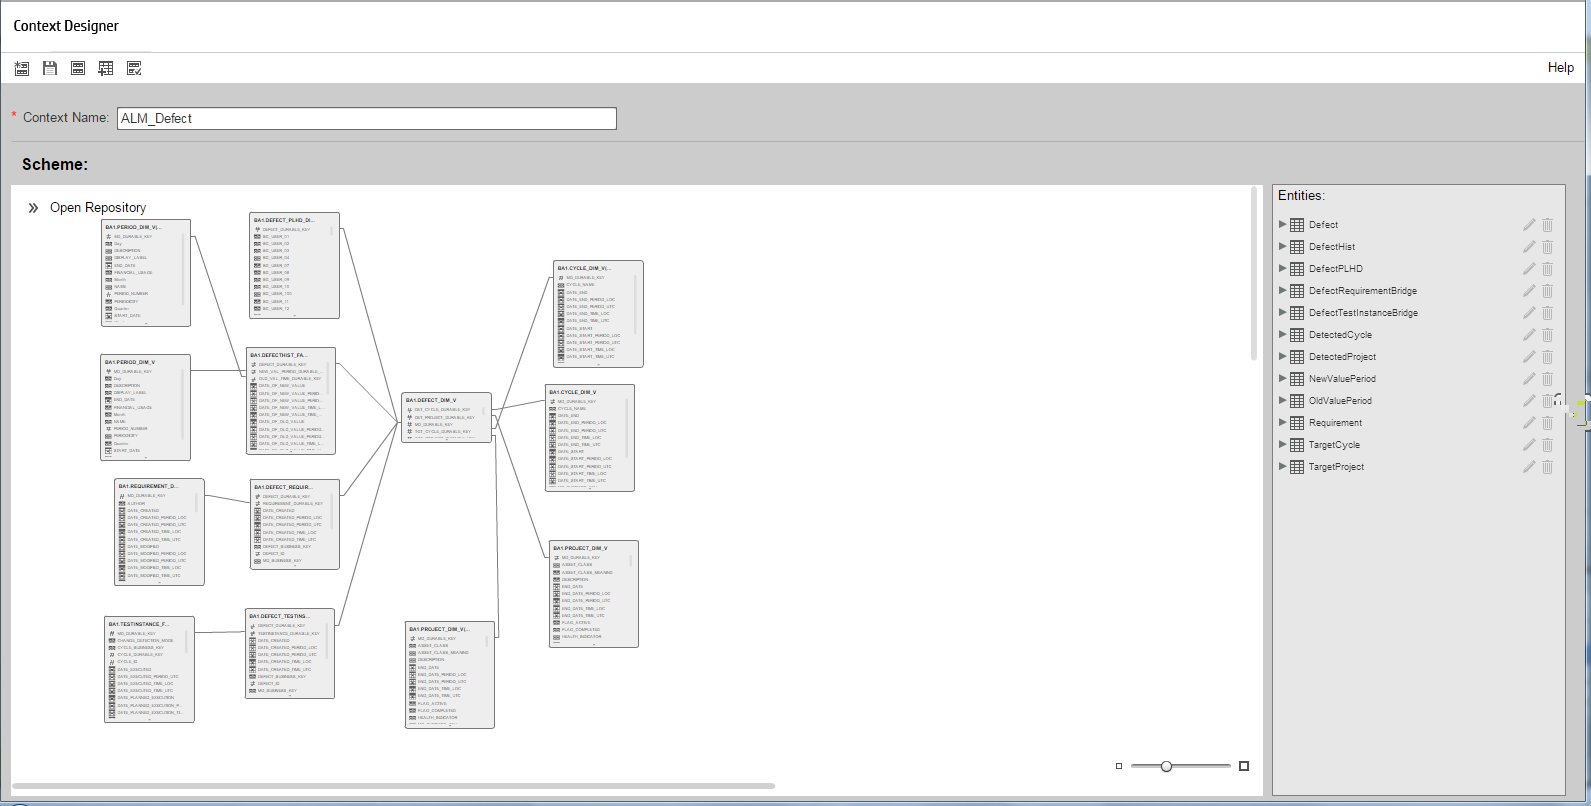
In the Entities area on the right, you can see the tables and the table columns that were selected to be part of the ALM_Defect Context itself.
It is recommended that the person who creates the KPI or Metric formula should be familiar with the ALM entities that are used in the ALM_Defect context:
The Defect_Hist table corresponds to one of the entities (DefectHist) that appears in the list of Variables that can be used when creating or modifying the formula of a KPI based on the ALM_Defect context. To access the KPI or Metric formula, click Studio, highlight the relevant KPI (% of Reopened Defects for example), click the Calculation Details tab, and then click Open Formula builder.
The variables you see in the formula builder correspond to the Entities in the Context Designer (above) and correspond to the <EntityName> in the syntax of the formulas (as explained in KPI or Metric Formula .)
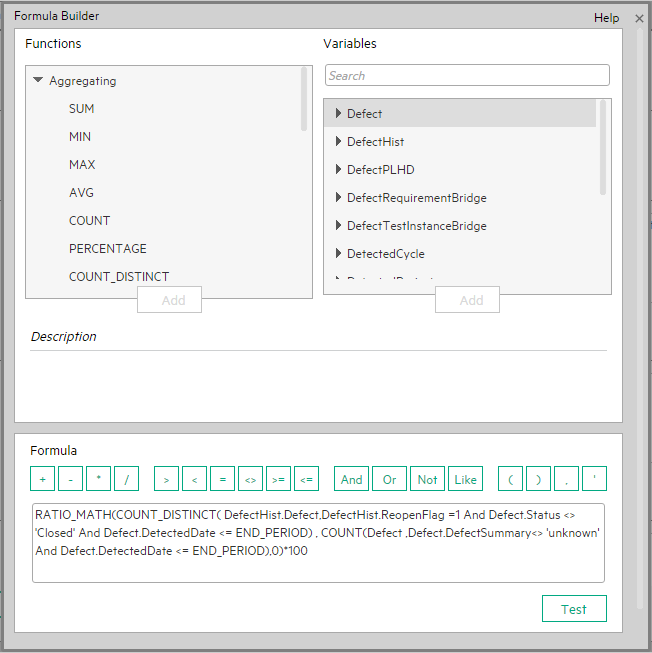
When you expand a variable, the items you see below correspond to the fields (in the Context Designer) and correspond to the <FieldName> items in the formulas syntax (as explained in KPI or Metric Formula.)

Use Case - Configure a KPI or a Metric formula
In this section you will learn how to configure a KPI or a Metric formula.
- Click the Studio button (top right corner) to open the Studio.
- In the Active KPIs pane, select the KPI or Metric whose formula you want to modify.
- In the right pane, click the Calculation Details tab and click the Open the Formula Builder link.
- Remove the current formula and start creating your own formula.
- Click Validate to make sure that the syntax is correct.
- Click OK to close the dialog and click Save to save the changed formula.
- Use the Test KPI button to check if the result you are getting according to the configuration, meets your expectation. If not, modify it and check it again.
Example
Let’s create a formula with the COUNT function (for this example we will use Incident Management as Business Context).
-
From the Functions pane, double click the COUNT function or select the COUNT function and click the Add button, or select the COUNT function and drag it to the bottom area.
The syntax of the formula appears above in the description area.
The COUNT function returns the number of entities satisfying the given Filter Expression condition. For example, if you want to count the number of open incidents you need the following entities:
- Entity to count is Incident
- Filter expression is Incident.Status = ‘Open’
-
Let’s add these entities to the COUNT function according to its structure:
- Click inside the formula brackets, go to the Variables pane, and locate the Incident entity (you can use the search field).
-
Double-click the entity or select the entity and click the Add button.
The Incident entity appears in the first section of the COUNT function.
- Move to the second section of the COUNT function, and locate the Status entity in the Variables pane.
- Add it to the formula.
-
You can now add the condition operator equal and select the Open value from the list.
The formula should be as follows: COUNT (Incident, Incident.Status=’Open’)
Movie: To display the relevant movie, open the ITBA application, click Help in the top right corner of the application main page and select the Movies option. Select the relevant movie. For details, see Access Movies.
Use-Case for IN_PERIOD
The IN_PERIOD formula is: <EntityName>.<FieldName> IN_PERIOD
You use IN_PERIOD in Filter expressions to specify the condition relative to the start of the calculation period defined for the KPI or Metric . The condition is related to the KPI or Metric time period.
If, for example, you want to count the number of incidents that occur per month using the Incident KPI which is a monthly KPI, you can use the following formulas:
| Formulas | Results for | |||
|---|---|---|---|---|
| June | July | August | September | |
| COUNT (INCIDENT, *) | 20 | 25 | 12 | 17 |
| COUNT(INCIDENT, INCIDENT.OPEN_DATE = IN_PERIOD) | 20 | 25 | 12 | 17 |
When performing a Calculation on the Context related to the INCIDENT KPI, the results stay the same.
| Formulas | Results for | |||
|---|---|---|---|---|
| June | July | August | September | |
| COUNT (INCIDENT, *) | 22 | 23 | 13 | 16 |
| COUNT(INCIDENT, INCIDENT.OPEN_DATE = IN_PERIOD) | 22 | 23 | 13 | 16 |
When performing a Recalculation on the Context related to the INCIDENT KPI:
-
The results for COUNT(INCIDENT, INCIDENT.OPEN_DATE IN_PERIOD) are correct because the values are recalculated for each month separately.
-
The results for COUNT (INCIDENT, *) are incorrect, as the formula counts ALL the incidents in the system without any time filtering (for example: 90) and replaces the values for each one of the months above with 90.
| Formulas | Results for | |||
|---|---|---|---|---|
| June | July | August | September | |
| COUNT (INCIDENT, *) | 90 | 90 | 90 | 90 |
| COUNT(INCIDENT, INCIDENT.OPEN_DATE = IN_PERIOD) | 20 | 19 | 10 | 10 |

Formula Builder Dialog Box

Note about the order of operations in formulas:
If more than one operator is used in a formula, ITBA follows a specific order to perform these mathematical operations. This order of operations can be changed by adding brackets to the equation. The order of operations is:
- Functions (aggregations and others)
- Brackets
- Division
- Multiplication
- Addition
- Subtraction
User interface elements are described below (when relevant, unlabeled elements are shown in angle brackets):
|
UI Element |
Description |
||||||||||
|---|---|---|---|---|---|---|---|---|---|---|---|
| Functions |
The list of functions you can use in the KPI or Metric formula.
|
||||||||||
| Variables |
The list of variables you can use in the KPI or Metric formula.
|
||||||||||
|
Description
|
A description of the function you have selected in the Functions area or a description of the variable you have selected in the Variables area. |
||||||||||
| Formula |
|
||||||||||
| Test |
Click to validate and test the formula and the filter. The system first performs the validation of both the formula and the filter together. It then tests the KPI or Metric and displays the result. |
||||||||||
| OK/Cancel |
Click:
Note In the Calculation details tab, the Save and Discard buttons become enabled and you can click Save to save the changes. |


-
The aggregating functions are as follows:
UI Element
Description
SUMFormula: SUM(<EntityName>.<FieldName>, <Filter Expression>)
Returns the sum of the field values of the entities that satisfy the condition specified in the Filter Expression.
Example
SUM(Cost.Amount, Cost.CostType=”Actual”)Note If you want to filter a calculation using all the possible values of the raw data, you can replace <Filter Expression> with a “*” (star).
Example If the Cost Type values are Actual and Planned, instead of SUM(Cost.Amount, Cost.CostType=”Actual” or Cost.CostType=”Planned”) write SUM(Cost.Amount, * ).
MIN Formula: MIN(<EntityName>.<FieldName>, <Filter Expression>)
Returns the lowest value of the field values of the entities that satisfy the condition specified by the Filter Expression.
Example
MIN(Cost.Amount, Cost.CostType=”Actual”)Note If you want to filter a calculation using all the possible values of the raw data, you can replace <Filter Expression> with a “*” (star).
Example If, for example, the Cost Type values are Actual and Planned, instead of MIN(Cost.Amount, Cost.CostType=”Actual” or Cost.CostType=”Planned”) write MIN(Cost.Amount, * ).
MAX Formula: MAX(<EntityName>.<FieldName>, <Filter Expression>)
Returns the highest value of the field values of the entities that satisfy the condition specified by the Filter Expression.
Example
MAX(Cost.Amount, Cost.CostType=”Actual”)Note If you want to filter a calculation using all the possible values of the raw data, you can replace <Filter Expression> with a “*” (star).
Example If the Cost Type values are Actual and Planned, instead of MAX(Cost.Amount, Cost.CostType=”Actual” or Cost.CostType=”Planned”) write MAX(Cost.Amount, * ).
AVG Formula: AVG (<EntityName>.<FieldName>, <Filter Expression>)
Returns the average of the field values of the entities that satisfy the condition specified by the Filter Expression.
Example
AVG(Cost.Amount, Cost.CostType=”Actual”)Note If you want to filter a calculation using all the possible values of the raw data, you can replace <Filter Expression> with a “*” (star).
Example If the Cost Type values are Actual and Planned, instead of AVG(Cost.Amount, Cost.CostType=”Actual” or Cost.CostType=”Planned”) write AVG(Cost.Amount, * ).
COUNT Formula: COUNT (<Entity Name>, <Filter Expression>)
Returns the number of entities that satisfy the condition specified by the Filter Expression.
Example
COUNT(Cost, Cost.CostType ='Actual')Note If you want to filter a calculation using all the possible values of the raw data, you can replace <Filter Expression> with a “*” (star).
Example If the Cost Type values are Actual and Planned, instead of COUNT(Cost.Amount, Cost.CostType=”Actual” or Cost.CostType=”Planned”) write COUNT(Cost.Amount, * ).
COUNT_DISTINCT Formula: COUNT_DISTINCT (<Entity Name>.<Field Name>, <Filter Expression>)
Returns the number of distinct values of the field in all the entities that satisfy the condition specified by the Filter Expression.
Example
COUNT_DISTINCT(Service.Name, Service.Name <> 'UNKNOWN')Note If you want to filter a calculation using all the possible values of the raw data, you can replace <Filter Expression> with a “*” (star).
Example If the Cost Type values are Actual and Planned, instead of COUNT_DISTINCT(Cost,Cost.CostType="Actual" or Cost.CostType="Planned") write COUNT(Cost,*).
PERCENTAGE Formula: PERCENTAGE (<Entity Name>, <Filter Expression1>, <Filter Expression2>,defaultValue)
Returns the ratio, expressed as percentage, of the number of entities that satisfy the condition specified by Filter Expression1 to the number of entities that satisfy the condition specified by Filter Expression 2.
defaultValue is optional and can be either an integer or a float number. By default, the defaultValue is 0; this is the value that is returned if the denominator equals 0. You can change the default value.
Example
PERCENTAGE(Cost, Cost.CostType ="Actual", Cost.CostType ="Planned", 0)Note If you want to filter a calculation using all the possible values of the raw data, you can replace <Filter Expression> with a “*” (star).
Example If the Cost Type values are Actual and Planned, instead of PERCENTAGE(Cost, Cost.CostType=”Actual”, Cost.CostType ="Actual" or Cost.CostType=”Planned”, 0) write PERCENTAGE(Cost, Cost.CostType=”Actual”, * , 0).
-
The mathematical functions are as follows:
UI Element
Description
SUM_MATH Formula: SUM_MATH (arg1, arg2, arg3, …)
Returns the sum of the set of arguments.
Example
SUM_MATH(6.36, 11.02, 51, -2.44, MAX(Cost.Amount, Cost.CostType='Actual'))MIN_MATH Formula: MIN_MATH (arg1, arg2, …)
Returns the lowest value of the set of arguments.
Example
MIN_MATH(SUM(Cost.Amount, Cost.CostType ='Actual'),SUM(Cost.Amount, Cost.CostType ='Planned'))MAX_MATH Formula: MAX_MATH (arg1, arg2, …)
Returns the highest value of the set of arguments.
Example
MAX_MATH(COUNT(Incident, Incident.Status='Open'),COUNT(Incident, Incident.Status='Reopened'))AVG_MATH Formula: AVG_MATH (arg1, arg2, …)
Returns the arithmetic average of the set of arguments.
Example
AVG_MATH(6.36, 11.02, 51, -2.44,SUM(Cost.Amount, Cost.CostType='Actual'))PERCENTAGE_MATH Formula: PERCENTAGE_MATH(numerator,denominator, defaultValue)
Returns the ratio, expressed as percentage of arguments: (numerator / denominator) * 100.
defaultValue is optional and can be either an integer of a float number.By default, the defaultValue is 0; this is the value that is returned if the denominator equals 0. You can change the default value.
Example
PERCENTAGE_MATH(Defect, Defect.severity = “High” , *)RATIO_MATH Formula: RATIO_MATH(numeratorVal,denominatorVal, defaultValue)
The function divides numerator by denominator. If denominator is 0 then the function returns defaultValue, or zero if <defaultValue> is not provided.
defaultValue is optional and can be either an integer of a float number.By default, the defaultValue is 0; this is the value that is returned if the denominator equals 0. You can change the default value.
Example
RATIO_MATH(SUM(Cost.Amount,Cost.CostType='Actual'),SUM(Cost.Amount,Cost.CostType='Planned'),0)DATE_CONVERT Formula:
DATE_CONVERT(<sourceFormat>, <destinationFormat>, <Mathematical Date Function>)Converts the results of <Mathematical Date Function> from the source format into the destination format.
Source Format can be one of the following: 'MS', 'S', 'M', 'H'.
Destination Format can be one of the following: 'S', 'M', 'H', 'D'. 'MS' = Millisecond, 'S' = Second, 'M' = Minute, 'H' = Hour, 'D' = Day
Example
DATE_CONVERT('MS','H', AVG(Incident.OutageEnd,PERIOD_ENTITY=OutageStartPeriod)- AVG(Incident.OutageStart,PERIOD_ENTITY=OutageStartPeriod) )
-
The dates are as follows:
UI Element
Description
IN _PERIOD Formula: <EntityName>.<FieldName> IN_PERIOD
Use in Filter Expressions to specify the condition relative to the start of the calculation period defined for the KPI or Metric . The condition is related to the KPI or Metric time period.
If you select Daily for the Calculation Period of a KPI/Metric, and if the KPI/Metric formula contains in_period(-XX), end_period(-XX), or Period_entity = Period (-XX), XX must be less than or equal to 365.
Example
COUNT(Incident, Incident.CreateTime IN_PERIOD)The incidents that are counted are those that were created during the current time period. If the KPI time frame is 'Weekly', the formula counts only the incidents created per week.COUNT(Defect,Defect.Open_In_Date IN_PERIOD)- COUNT(Defect,Defect.Open_In_Date IN_PERIOD(-12))Counts the number of defects in the current period and subtracts the number of defects that occurred during the 12 previous periods. For example, in case of 'monthly' periodicity, the formula calculates the number of defects that occurred in 01/13 and subtracts the number of defects that occurred in 01/12.
IN_CURRENT_YEAR Formula: <EntityName>.<FieldName> IN_CURRENT_YEAR
Use in Filter expressions to specify the condition relative to the current year during the calculation.
Example
SUM(Period.PeriodNumber , Period.Year IN_CURRENT_YEAR)In recalculation of the KPI a couple of years back, the Period.Year is replaced with the year for which the calculation is performed at each given time. The value of the field Period.Year should be String and should fit the pattern: FYxxxx.<br>For example: FY2011 or FY2009.END_PERIOD Formula: <EntityName>.<FieldName> conditional operator END_PERIOD
Use in Filter expressions to specify the condition relative to the end of the calculation period defined for the KPI or Metric . The condition is related to the time period.
If you select Daily for the Calculation Period of a KPI/Metric, and if the KPI/Metric formula contains in_period(-XX), end_period(-XX), or Period_entity = Period (-XX), XX must be less than or equal to 365.
Examples
COUNT(Incident, Incident.CreateTime <= END_PERIOD)The incidents that are counted are those that were created before the current time period ended. If the KPI time frame is 'Weekly', the formula counts only the incidents created up to the end of that weekCOUNT(Defect,Defect.Open_In_Date END_PERIOD)- COUNT(Defect,Defect.Open_In_Date END_PERIOD(-12))Counts the number of defects created till the completion of the current period and subtracts the number of defects that occurred in the past 12 periods. For example, in case of 'monthly' periodicity, the formula counts the defects that occurred from the beginning of the calculation period up to 01/13 and subtracts the number of defects that occurred from the beginning of the calculation period up to the 12 months before 01/13.
PERIOD_ENTITY Formula: PERIOD_ENTITY=Period
Use in Filter expressions to specify the entity that represents the PERIOD table that calculation are based on.
Some of the Universes are built as Data Warehouses, which means that they already store aggregated values per period. You can specify in this field, the entity in the Universe that corresponds to the Period you want to use. The content of that entity determines the entries that are filtered for the calculation.
If you select Daily for the Calculation Period of a KPI/Metric, and if the KPI/Metric formula contains in_period(-XX), end_period(-XX), or Period_entity = Period (-XX), XX must be less than or equal to 365.
Examples
COUNT(Incident, PERIOD_ENTITY = CreateTimePeriod)COUNT(SLAStatus,PERIOD_ENTITY = Period(-12))In this case the period is shifted 12 periods back. 01/13 is shifted to 01/12.
KPI_PERIODICITY_TYPE Formula: KPI_PERIODICITY_TYPE=Period
A constant that is replaced by the specific KPI or Metric Calculation Period that is to be used for the calculation. For details, see KPI or Metric Configuration and Calculation Details.
Example
COUNT(Incident, CreateTimePeriod.Periodicity = KPI_PERIODICITY_TYPE)NOW A constant that is replaced by the current calculation date during the calculation.
Example
COUNT(Incident, NOW - Incident.CreateTime > 5*DAY)HOUR A constant that represents one hour.
Example
COUNT(Incident, NOW - Incident.CreateTime > 5*HOUR)DAY A constant that represents one day.
Example
COUNT(Incident, NOW - Incident.CreateTime > 5*DAY)WEEK A constant that represents one week.
Example
COUNT(Incident, NOW - Incident.CreateTime > 5*WEEK)
We welcome your comments!
To open the configured email client on this computer, open an email window.
Otherwise, copy the information below to a web mail client, and send this email to SW-Doc@hpe.com.
Help Topic ID:
Product:
Topic Title:
Feedback: