
Searching the Help
To search for information in the Help, type a word or phrase in the Search box. When you enter a group of words, OR is inferred. You can use Boolean operators to refine your search.
Results returned are case insensitive. However, results ranking takes case into account and assigns higher scores to case matches. Therefore, a search for "cats" followed by a search for "Cats" would return the same number of Help topics, but the order in which the topics are listed would be different.
| Search for | Example | Results |
|---|---|---|
| A single word | cat
|
Topics that contain the word "cat". You will also find its grammatical variations, such as "cats". |
|
A phrase. You can specify that the search results contain a specific phrase. |
"cat food" (quotation marks) |
Topics that contain the literal phrase "cat food" and all its grammatical variations. Without the quotation marks, the query is equivalent to specifying an OR operator, which finds topics with one of the individual words instead of the phrase. |
| Search for | Operator | Example |
|---|---|---|
|
Two or more words in the same topic |
|
|
| Either word in a topic |
|
|
| Topics that do not contain a specific word or phrase |
|
|
| Topics that contain one string and do not contain another | ^ (caret) |
cat ^ mouse
|
| A combination of search types | ( ) parentheses |
|


![]()
![]()

- Create the Dashboard Contents in the Studio
- About Templates
- Scorecard Template
- Perspective Templates
- Objective Templates
- KPI Templates
- Metric Templates
- Folders
- Activate Scorecards, Perspectives, Objectives, Metrics, and KPIs Templates
- Create Active Scorecards, Perspectives, Objectives, Metrics, or KPIs
- Scorecard Configuration Details
- Perspective Configuration Details
- Objective Configuration Details
- Objective KPIs
- Delete a Node
- KPI and Metric Formula and Filter, Threshold, Value, Trend, and Score
- KPI or Metric Configuration and Calculation Details
- KPI or Metric Formula
- KPI or Metric Filter
- KPI or Metric Business Context
- Calculation
- Recalculation
- Calculation Scheduling
- Calculation and Recalculation Monitoring
- Synchronization of Changes in the Studio with Display in the Dashboard and the Explorer tab
An activated Scorecard displays, in the Dashboard relevant Scorecard component, how well the corresponding objectives are met.
You can display and modify the configuration information for the selected active Scorecard in the Active KPIs pane.
Note In this section, "node" represents Scorecards.
Click a Scorecard in the Active KPIs pane.

 About Active Scorecards
A Scorecard is a high-level snapshot (visual summary) of any organizational performance. Scorecards display a collection of Objectives, and assess the performance of the organization by viewing the status of Objectives.
A Scorecard is a way to map and translate complex business information into something that is understandable to everyone. The methodology starts with targets defined by the organization, followed by Scorecard Objectives.
The following table shows how core Scorecard elements relate to key performance questions.
|
Scorecard Element |
Key Performance Question |
More Information and Example |
|---|---|---|
| Perspective\Strategy |
What is the strategy trying to achieve? |
For details about Perspectives, see Perspectives. A Scorecard can include one or more Perspectives. Example Operational excellence. |
| Objective |
What is the objective trying to achieve? |
For details about Objectives, see Objectives. A Perspective can include one or more Objectives. Example Increase responsiveness in IT to service requests for PC orders by 20% in 2010. |
| KPI |
How will performance be measured? |
For details about KPIs, see Activate Scorecards, Perspectives, Objectives, Metrics, or KPIs Using Templates. An Objective can include more than one KPI. Example Time to order, configure, and install PC. |
| Threshold | What performance level is required? | 24 hours. |
Out-of-the-box templates of Scorecards, Perspectives, Objectives, and KPIs are provided. These templates correspond to business elements. For details, see Activate Scorecards, Perspectives, Objectives, Metrics, or KPIs Using Templates.
Active Scorecards, Perspectives, Objectives, and KPIs display real data in the Dashboard. For details, see Active KPIs Pane.
Scorecard names must be unique in the same active tree.
When you drag and drop a Scorecard template to the Active KPIs pane you create an active copy of the Scorecard template with all its sub-tree structure. If a Scorecard with the same name already exists in the Active KPIs pane, the name of the newly added Scorecard gets the (n) suffix (where n=0 the first time and n gets incremented if necessary).
Impact of changes to configurations in the Studio on the display in Dashboard and the EXPLORER tab
Changes in the STUDIO have impacts on the display in Dashboard and EXPLORER. For details, see Synchronization of Changes in the Studio with Display in the Dashboard and the EXPLORER tab.
Balanced Scorecards
A balanced scorecard should translate a business units mission and strategy into tangible objectives and measures.
Balanced scorecards strive to present an immediately comprehensible picture of a complete organizational strategy. This approach recognizes that the different aspects of a business all influence each other. A balanced scorecard examines performance from several critical perspectives.
The balanced scorecards can be a great resource for managing the IT function, as they expose all the perspectives that are crucial to the executive.
Typically, a balanced scorecard depicts the following perspectives:
IT Value Perspective
The name IT value comes from the motivation to expose the value of IT to the business. It’s main role is also to expose to the organization executives the alignment between IT and the business.
The IT value perspective portray the economic results of previous business decisions and actions. Financial metrics generally lag behind actions, and therefore might not necessarily reflect the business as it is run today. However, financial metrics often determine whether a particular strategy is successful.
Financial metrics are often reflective of the stage of a businesses life-cycle (Growth, Sustain, and Harvest). Growth financial requirements may focus on the percentage growth rates in revenues and sales growth rates in target markets, customer groups, and regions. Businesses in the sustain stage may measure return on investment, return on capital employed, and economic value added. Harvest stage analytics are designed to measure the businesses ability to maximize cash flow back to the corporation. Core financial metrics are commonly related to profitability (such as operating income, return on capital employed, and economic value added). Other financial metrics can be related to shareholder values (ROI, and Financial Risk Management) or measurements (revenue growth and mix, cost reduction/productivity improvement, and asset utilization).
Other IT value perspectives can be:
- Any significant forecast can have a real impact on the profitability of the overall enterprise.
- It is important for the executive to always know where the IT stands in relation to the expense forecast.
- Keeping expenses in line with expectations is crucial.
- The executive may be tracking specific cost reduction objectives. A set of financially-oriented objectives and metrics is a critical component of any useful Dashboard.
- How does my spending relate plan versus region.
Customer Perspective
This perspective is often the second perspective to be defined when creating a balanced scorecard. This perspective focuses on aligning core customer outcome measurements; satisfaction, loyalty, retention, acquisition, and profitability to targeted customers and market segments. These value propositions represent the drivers, the lead indicators, for the core customer outcome measurements. “What must the company deliver to its customers to achieve high degrees of satisfaction, retention, acquisition, and, eventually, market share?” Alternate measurements within a customer segment can be either the share of wallet, segment-by-segment, or customer-by-customer. Beyond the core customer metrics, customer value propositions can be organized into three categories; product/service attributes, customer relationship, and image and reputation.
Example
- Metrics for Product/service attributes could be: service, price, and quality.
- Metrics for Customer relationship could be: delivery to the customer, response and delivery time and customer experience.
- Metrics for Image could be: market share, brand recognition.
Operational Excellence Perspective
The operational perspective reflects the internal business processes that support the strategy. Once the financial and customer perspectives have been designed, the customers perspective will define their internal perspective. Typically, customers might not notice these processes directly, but business must excel at these processes to succeed. Looking at these critical business processes with a lean and six sigma lens, consumers of the BSC see supplemental measures of quality, yield, throughput, and cycle time that quantify potential financial and customer objectives such as reducing costs and improving the customer’s experience. By removing waste and defects from end-to-end critical business processes, organizations can identify opportunities to mature their processes (sigma level or maturity scales) and reduce risk and cost. Another metric: Break Even Time (BET), can be a useful measurement of the product development cycle. This measurement stresses the importance of productivity while also capturing and comparing productivity. This measurement is an indicator rather than an outcome measurement.
Other perspectives can be:
- Executives must constantly inspect and refine the IT organization's internal processes to ensure efficiency, predictability, and long term scalability.
- Key internal IT processes may include project management, change management, support management, and network management.
- There may also be specific cycle time reduction or quality initiatives tracked at this perspective.
- Objectives and metrics related to internal process improvement are an important part of a executive balanced view of IT maturation.
Future Orientation Perspective
The future orientation perspective covers the human infrastructure of the organization and is the final perspective to be developed. It comes last because as you define the other strategies and objectives you may determine that there are gaps and opportunities to develop the organization. This perspective addresses performance indicators that concern employees, systems, and organizational procedures.
The three primary categories within learning and growth are employee capabilities, information systems capabilities, and motivation empowerment and alignment. Three core employee measurements are employee satisfaction, employee retention, and employee productivity. There may be variations on these metrics based on the related strategies.
Example Employee productivity may be segmented by types of employees or the ratio of those types could also be supplemental. Opportunities to re-skill the workplace may be additional measures based on new technologies, frameworks, or customer segments. Organizational objectives around learning or skills inventories based on roles could be measured as well. Gaps could result in development or outsourcing opportunities.
Other perspectives can be:
- Investment in people within the IT organization is crucial for the long term success.
- Training in pursuit of technical certification or increased capability is a very good indicator of the level of commitment that management has to the development of IT employees.
- Other key indicators include salary competitiveness, employee satisfaction, and employee turnover.
- Where is my team strong and weak?
- Am I growing staff by moving them around?
- What are the total people resources of IT and how do they divide out for Full Time Employees versus Contractors and for Onshore versus Offshore?
User-Orientation Perspective
- The executive direct customers are the senior managers of the business units.
- It is very important that the executive be in touch with the customer perspective on IT effectiveness.
- Measuring the reliability of the systems the customers depend upon.
- Support levels, project status, and overall satisfaction ratings should also be measured.
- How is my customers’ satisfaction improving over time?
- How are the quantifiable elements of customer service stacking up—SLA, Request, and Projects?
- How well am I managing the customer’s money?

Customize the Node
To customize the node:
- Click the Studio button (top right corner) to open the Studio.
- In the Active KPIs pane, select the relevant node. Its details are displayed in the Configuration Details pane.
- Modify the node's details and click Save to save the changes.
Populate the Node
- Click the Studio button (top right corner) to open the Studio.
- In the Active KPIs pane, select the relevant node. Its details are displayed in the Configuration Details pane.
- You can also populate the node by adding or removing the following nodes:
- Perspectives. For details, see Perspective Configuration Details.
- Objectives. For details, see Objective Configuration Details.
- KPIs. For details, see KPI or Metric Configuration and Calculation Details.
- KPI Breakdowns. For details, see KPI Breakdowns.

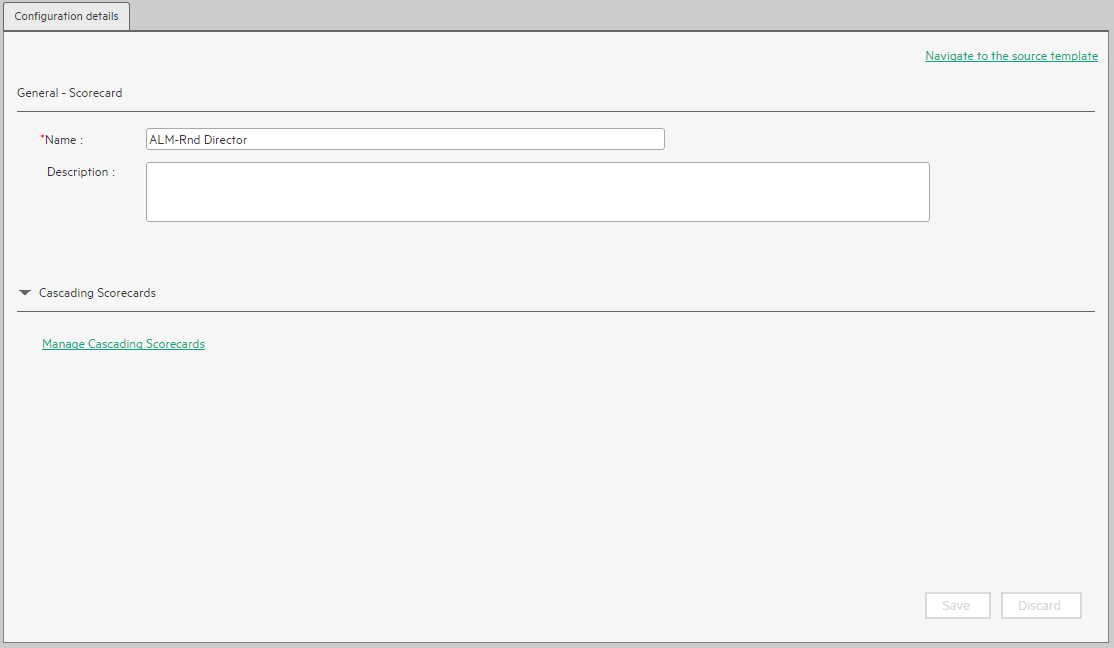
Configuration Details Tab for a Scorecard
This page displays configuration information for the selected active Scorecard in the Active KPIs pane.
Changes in the STUDIO have impacts on the display in Dashboard and EXPLORER. For details, see Synchronization of Changes in the Studio with Display in the Dashboard and the EXPLORER tab.
User interface elements are described below (when relevant, unlabeled elements are shown in angle brackets):
|
UI Element |
Description |
|---|---|
| Navigate to the source template |
Moves the cursor to the template that was used to create the current Scorecard, in the KPI Library pane. The details of the template are displayed in the Configuration Details pane. |
| Save | Click to save the changes. |
| Discard | Click to discard the changes you have made since the last Save operation. |

|
Click the refresh button, in the top right corner, to refresh the display. |
| General - Scorecard | |
| Name
|
The name of the active Scorecard. Limitations:
|
| Description |
The description of the Scorecard. Limitations: The maximum number of characters is 1000. |
| Id |
The Id of the Scorecard. It is automatically assigned. This information is displayed only when in debug mode. To set the debug mode, click ADMIN > Settings > BA Settings, and in Debug Mode, select the Application Debug Mode setting. |
| Type |
The type of Scorecard. It is automatically assigned. This information is displayed only when in debug mode. To set the debug mode, click ADMIN > Settings > BA Settings, and in Debug Mode, select the Application Debug Mode setting. |
| Cascading Scorecards | |
| Manage Cascading Scorecards
|
Click to open the Manage Cascading Scorecards dialog box where you can select the Scorecards that are to be the target Scorecards for the drilldown from the current Scorecard. For details, see Cascading Scorecards.
|
| Name | The name of the Cascading Scorecard. |
| Remove |
Click the relevant Remove |
 button to remove the selected Scorecard from the list of Cascading Scorecards.
We welcome your comments!
To open the configured email client on this computer, open an email window.
Otherwise, copy the information below to a web mail client, and send this email to SW-Doc@hpe.com.
Help Topic ID:
Product:
Topic Title:
Feedback: