


Understand Confusion Matrix data
The following figure shows an example Confusion Matrix.
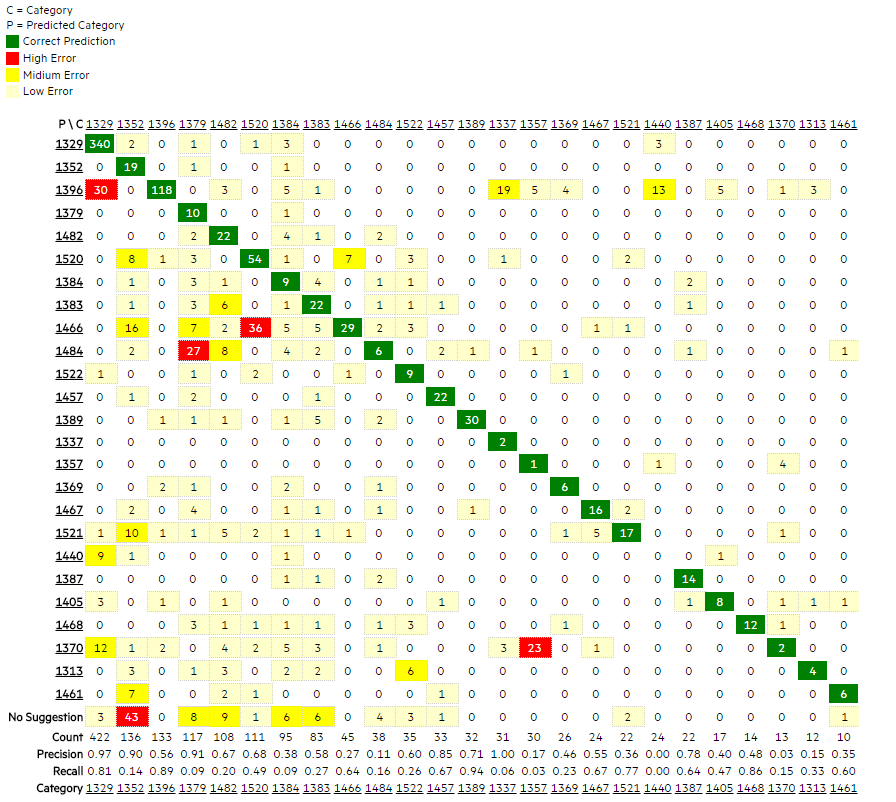
A Confusion Matrix is a two-dimensional matrix: each column header is a true Category ID and each row header is a predicted Category ID. Each intersection cell lists the number or ratio of records that actually belong to the column category but are predicted as the row category.
Each value on the diagonal line indicates the number or ratio of correctly predicted tickets for this category, and is highlighted in green.
Each of other values indicates the number of ratio of incorrectly predicted tickets for the category, and is highlighted in light yellow, dark yellow, or red, based on the Medium Error Threshold and High Error Threshold values that you have defined.
You can find the following information from the header of Confusion Matrix form.
| Item | Description |
|---|---|
| Comment | In this field, you can add comments for this test round. |
| Test Time | Timestamp of this test round. |
| Test Result |
The accuracy results of this test round, including the following:
|
Also, at the bottom of the Confusion Matrix table, there are several other things, which are aligned to each category:
| Item | Description |
|---|---|
| No suggestion |
This is the number of tickets in this category that the system did not provide a suggested category. |
| Count |
This is the total number of test tickets in this category, including successful, failed, and no suggestion. |
| Precision | A precision value indicates the ratio of the number of correctly predicted records in a row (the green number in a row) to the sum of all predicted records in the same row (sum of the row). |
| Recall |
A recall value indicates the ratio of correctly predicted records (the green number in a column) to the sum of all predicted records in this category (sum of the column). |


