


View data distribution analysis results
Follow these steps to view data distribution results:
- Go to System Administration > Ongoing Maintenance > Smart Analytics > Smart Ticket.
- Click Search.
- Select a Smart Ticket task from the list, and then click View Distribution.
The following figure shows an example based on the out-of-box data.
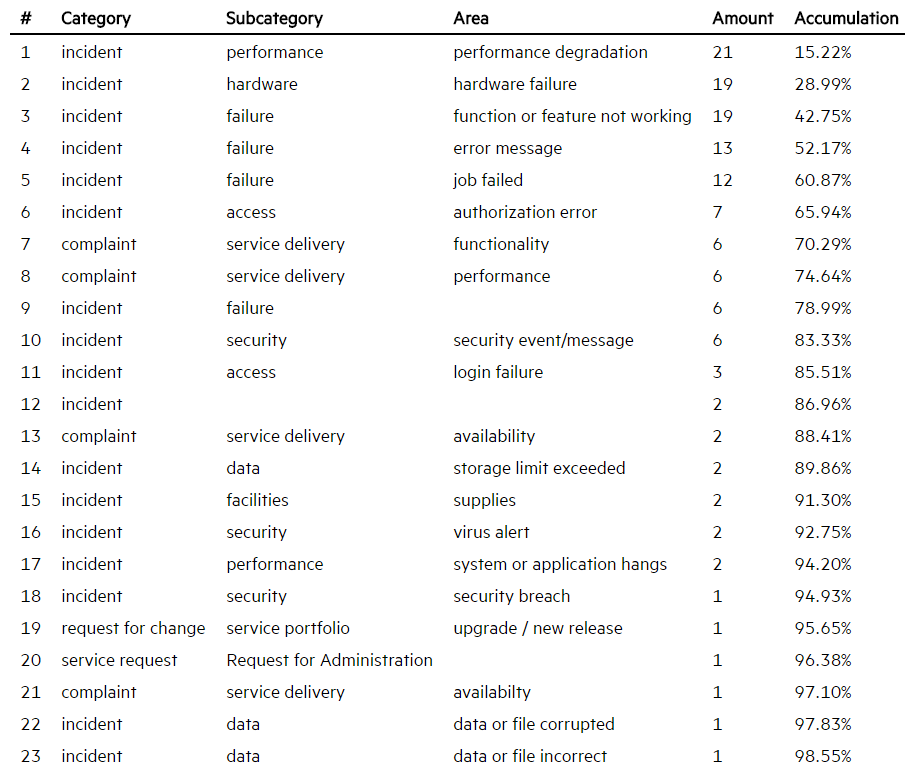
The columns of Category, Subcategory, and Area are different levels in the category hierarchy of the interactions in the OOB system, the “Amount” column is the number of tickets of each category, and the column of “Accumulation” is the accumulated percentage of interactions of the total records.
We can see that 90% means the categories of the first 14 rows constitute the majority of the OOB interactions. So, with this data distribution analysis tool, you can get a better understanding of your tickets, which can in turn help you better train your Smart Analytics system from the following perspectives.
You can perform the following tuning tasks based on your data distribution results.


