


Set debugging parameters using dynamic debugging
Applies to User Roles:
System Administrator
Note Some debugging parameters can be enabled and disabled using the dynamic debugging feature, while some can be enabled but cannot be disabled using this feature. For more information about these parameters, see Dynamic debugging of user sessions or schedulers.
To set debugging parameters for a user session or scheduler, follow these steps:
- Click System Status. The system status form opens.
- Type the following command in the Command field for the user session or scheduler:
s
-
Click Execute Commands.
The Operator Status Display form (operator.status.g) opens.
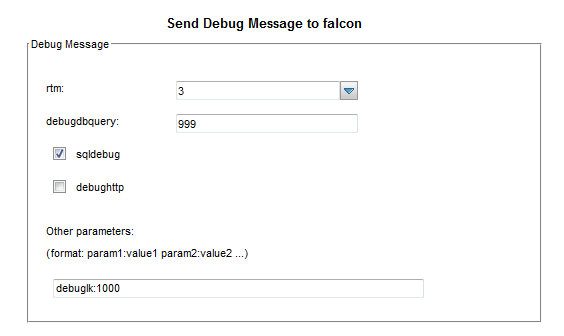
- Click Send Debug Msg. The Send Debug Message form opens.
-
Set debugging parameters as needed. The following figure shows an example.
-
Click Send Debug Message. A message is displayed:
Message sent to all users specified. -
Click End to exit.
-
Check the server log file for relevant debugging information of the session or scheduler.
-
Once you have completed troubleshooting, you are recommended to disable the debugging parameters for the user session or scheduler. To do this, repeat the steps above and disable the parameters.
Note Some parameters cannot be disabled using dynamic debugging. To disable such debugging information, disconnect the user session or manually restart the scheduler.
Alternatively, you can send the dynamic debugging message using Service Manager JavaScript. To do this, follow these steps:
- Click Tailoring > Script Library.
-
Add a new debugging JavaScript using the following format:
var debugmsg="<parameter> log:<directory and log file name>";
var rc=system.functions.rtecall("setdebug",vars.$L_rc, debugmsg );
You can specify one or more space-delimited parameters in
debugmsg. In addition, you can also customize the output directory and the log file name for the debugging messages. Iflog:<directory and log file name>is omitted, the system outputs the debugging messages to the default server log file (sm.log).In the following example, the system writes debug messages about RDBMS connections of the current session and prints this information to the mysm.log file:
var debugmsg="sqldebug:1 log:../logs/mysm.log";
var rc=system.functions.rtecall("setdebug",vars.$L_rc, debugmsg );
print(rc)
In the following example, the system writes debug messages about RDBMS connections and Response Time Monitor (RTM) performance statistics of the current session and prints this information to the sm.log file.
var debugmsg="sqldebug:1 rtm:3"; var rc=system.functions.rtecall("setdebug",vars.$L_rc, debugmsg ); print(rc) -
Click Execute, and then click OK to exit.
Note Your changes affect the current session only. The debugging process starts immediately after you executed the JavaScript.
- Check the log file for relevant debugging information of the session or scheduler.
Related topics


