


Sample report for calculation
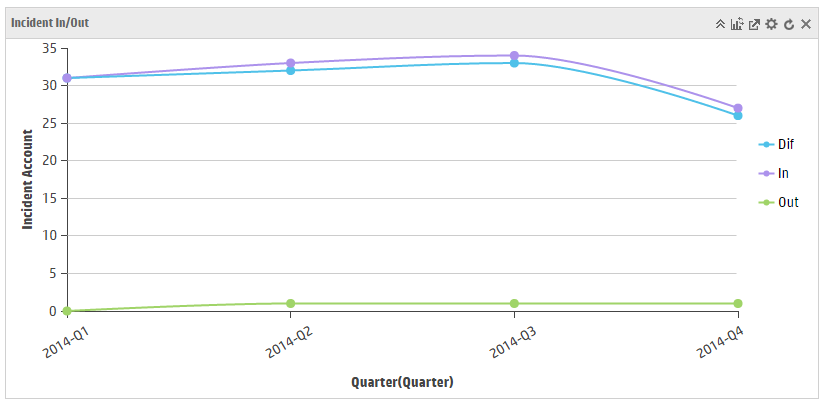
Here is a sample calculation type report for your reference. This report displays the number of incidents opened, incidents closed, and the difference between these two numbers by quarter.
Note Select Calculation from the drop-down box next to the Type of chart field, and then you can see the calculation properties.
| Fields | Value | Description |
|---|---|---|
| Type of chart | Line | Shows the current chart type. You can change it by selecting the chart type from the drop-down list. |
| Refresh Interval | Recurs every 1 day |
Specifies the refresh interval to generate a new report according to your report configurations. Note This is for report data refresh only. Users need to manually refresh the report content or the dashboard to get the latest report data. |
| Aggregator | Count |
Shows the data aggregation method. In this example, the report data is the count number of Incidents. |
| Group By Field - A1 | Open Time: Quarter |
Specifies the first field for calculation. This field shows that the number of open Incidents in each quarter during the specified time period. |
| Group By Field - A2 | Close Time: Quarter |
Specifies the second field for calculation. This field shows that the number of closed Incidents in each quarter during the specified time period. |
| Query - A1 | open.time>startofyear(startofyear() - 1) and open.time< startofyear() |
Shows the query content for the current report. This query means that the report collects all the open incidents from the start of the last year to the start of this year. |
| Query - A2 | close.time>startofyear(startofyear() - 1) and close.time<startofyear() |
Shows the query content for the current report. This query means that the report collects all the closed incidents from the start of the last year to the start of this year. |
| Calculation Formula | A1-A2 (Label: Dif) |
Specifies the calculation formula you defined for this report. The formula in this example calculates that number difference between the open Incidents and the closed incidents. The Dif label is assigned for the calculated result and shown as the legend in the report. |
| A1 (Label: In) | This formula means that the report also displays all the open incidents and assign the In label for this data. The label is shown as the legend in the report. | |
| A2 (Label: Out) | This formula means that the report also displays all the closed incidents and assign the Out label for this data. The label is shown as the legend in the report. | |
| X-Axis Label | Quarter |
Specifies the label for the X-axis in the report. |
| Y-Axis Label | Incident Count |
Specifies the label for the Y-axis in the report. |
Related topics
My reports
My dashboards
Report schedule and distribution
Report administration
Related topics
Create a report
Create a dashboard
Create a report schedule
Related topics


