


Sample report for duration
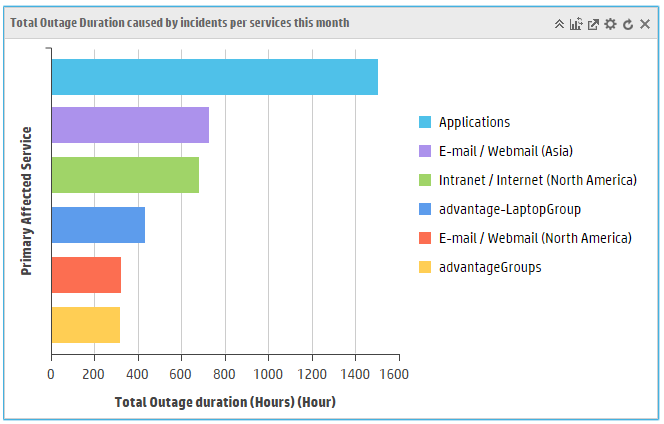
Here is a sample duration type report for your reference. This report displays a summary of the outage duration of incidents, sorted by service.
Note Select Duration from the drop-down box next to the Type of chart field, and then you can see the duration properties.
| Fields | Value | Description |
|---|---|---|
| Type of chart | Horizontal bar | Shows the current chart type. You can change it by selecting the chart type from the drop-down list. |
| Refresh Interval | Recurs every 1 day |
Specifies the refresh interval to generate a new report according to your report configurations. Note This is for report data refresh only. Users need to manually refresh the report content or the dashboard to get the latest report data. |
| Aggregator | Sum |
Shows the data aggregation method. In this example, the report data is the time summary of the duration. |
| Duration Start Field | Outage Start | Shows the duration start field used for calculation in the report. |
| Duration End Field | Outage End | Shows the duration end field used for calculation in the report. |
| Duration Unit | Hour | Shows the duration unit displayed in the report. |
| Duration Label | Total Outage duration | Shows the duration label for the report. The label is displayed as the legend in the report. |
| Query | open.time>startofmonth() |
Shows the query content for the current report. This query means that the open time of the Incidents to be collected should be earlier than the start of the this month. |
Related topics
My reports
My dashboards
Report schedule and distribution
Report administration
Related topics
Create a report
Create a dashboard
Create a report schedule
Related topics


