


Chart > Vertical bar
Here are the vertical bar setting preferences and example for your reference.
| Tab | Fields | Description |
|---|---|---|
| Chart Properties | Type of chart | Shows the current chart type. You can change it by selecting the chart type from the drop-down list. |
| Chart by | Shows the query type for the report. The default value is Aggregate query. | |
| Group by field |
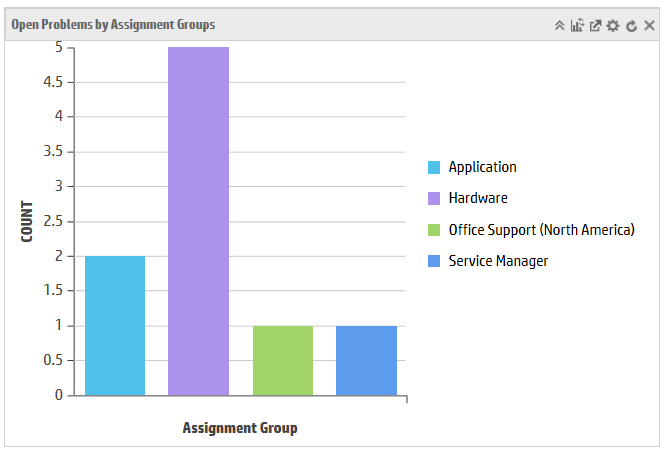
Shows the field that the records are grouped by in the report. For example, one report might show the number of Incidents by customer; another report might show the number of Incidents by priority. You can select multiple level fields by clicking the Multi Level Field icon. If you choose a field of date or time, you need to choose a calculator. And if the two group by fields are both date and time fields, they should be the same one. |
|
| Stacked field | Shows the field that the records are stacked by in the report. You can select multiple level fields by clicking the Multi Level Field icon. | |
| Metrics |
Shows the data aggregation method. Vertical bar supports five aggregation types: sum, count, average, max, and min. Note When you select the count aggregation type, the aggregation value field is invisible. When you select the sum, average, max, or min aggregation types, you can select the aggregation value from the drop-down list. |
|
| Query | Shows the query content for the current report. You can click the Query Builder to define the query to display desired information. You can also write a new query directly. For more information about how to edit a query, see Build the query strings and other related topics. | |
| Advanced settings | Decimal Places | Specifies the number of decimal places at which the report calculates the record percentage. Service Manager provides up to five decimal places. |
| Show Legend | Specifies the legend location in the report. No legend is displayed when None is selected. | |
| Show Records | Specifies the permitted maximum number of record displayed in a report ordered by the legend or the top N. | |
| Support Top N | If this option is selected, the report displays the top number records as defined in the Show Records field. | |
| Drill Down Process |
Specifies whether clicking a record in the report will drill down to the record stored in the ToDo table or to the record details page.
|
|
| Colored Ranges | Specifies any colored ranges that are displayed on the report. For more information about setting colored ranges, see Add colored ranges to a report. |
Related topics
My reports
My dashboards
Report schedule and distribution
Report administration
Related topics
Create a report
Create a dashboard
Create a report schedule
Related topics


