


Pivot Table
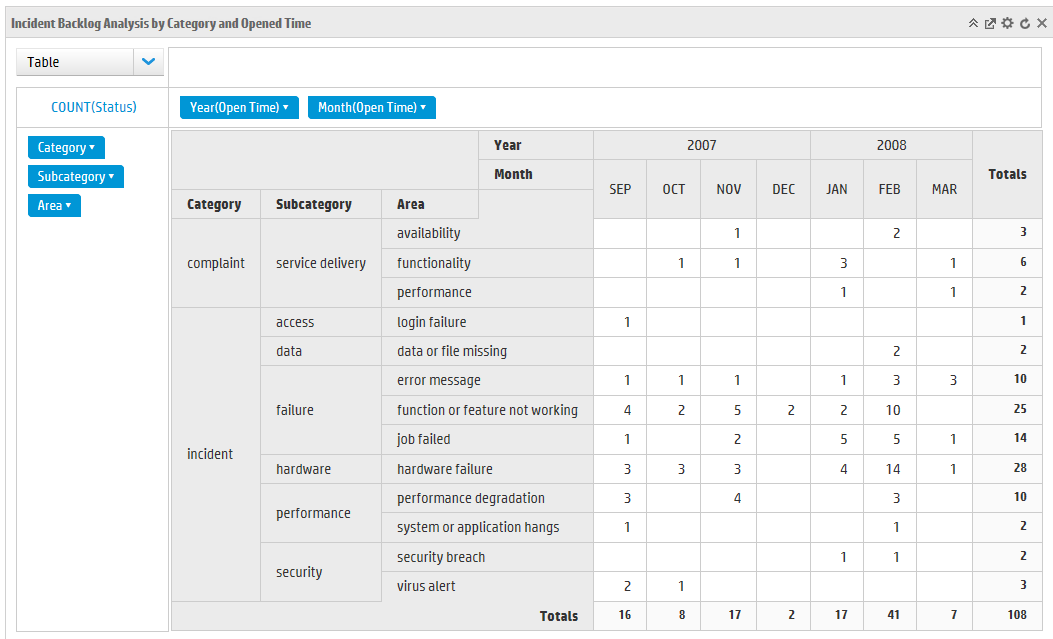
Here are the pivot table setting preferences and example for your reference. Service Manager supports five pivot display types: Table, Table BarChart, HeatMap, Row HeatMap, and Col HeatMap. You can click the row, the column, or the candidate field to filter the data in the pivot.
| Tab | Fields | Description |
|---|---|---|
| Pivot Table Properties | Aggregator |
Shows the data aggregation method. The pivot table supports five aggregation types: sum, count, average, max, and min. Note When you select the count aggregation type, the aggregation value field is invisible. When you select the sum, average, max, or min aggregation types, you can select the aggregation value from the drop-down list. |
| Row Fields | Click to select the row field and the calculator type from the drop-down list. The report displays the row field as an active button. You can drag and drop the button directly to the pivot table to redesign the report. | |
| Column Fields | Click to select the column field and the calculator type from the drop-down list. The report displays the column field as an active button. You can drag and drop the button directly to the pivot table to redesign the report. | |
| Candidate Fields | Click to select the candidate field and the calculator type from the drop-down list. The report displays the candidate field as an inactive button. You can drag and drop the button directly to the pivot table to redesign the report. Once this field is added to the pivot table, the button becomes active. | |
| Query | Shows the query content for the current report. You can click the Query Builder to define the query to display desired information. You can also write a new query directly. For more information about how to edit a query, see Build the query strings and other related topics. | |
| Advanced settings | Show Records | Specifies the permitted maximum number of records displayed in a report. |
| Decimal Places | Specifies the number of decimal places at which the report calculates the record percentage. Service Manager provides up to five decimal places. | |
| Drill Down Process |
Specifies whether clicking a record in the report will drill down to the record stored in the ToDo table or to the record details page.
|
Note You can only save the pivot definition change of the row, the column, and the candidate.
Related topics
My reports
My dashboards
Report schedule and distribution
Report administration
Related topics
Create a report
Create a dashboard
Create a report schedule
Related topics


