Centralized CI Visualization and Impact Analysis
Once Service Manager is integrated with UCMDB and UCMDB Browser, Service Manager users can access UCMDB Browser directly from within Service Manager to visualize CI relationships and simulate the impact in the context of an affected service or configuration item (CI) in Service Manager.
If light-weight single sign-on (LW-SSO) is not enabled for the integration, Service Manager users are prompted with UCMDB Browser login page; however, the integration provides a Use a dedicated user account option, which enables you to configure a dedicated UCMDB Browser user account so that users bypass UCMDB Browser login page.
Additionally, UCMDB Browser CI visualization and impact graphs are displayed according to the user's SM login language, which is English by default.
Important To view UCMDB Browser CI visualization and impact graphs embedded in Service Manager, users are recommended to use the latest Firefox or Chrome. This is because Internet Explorer 11 consumes too many resources and therefore may cause performance issues.
CI Visualization
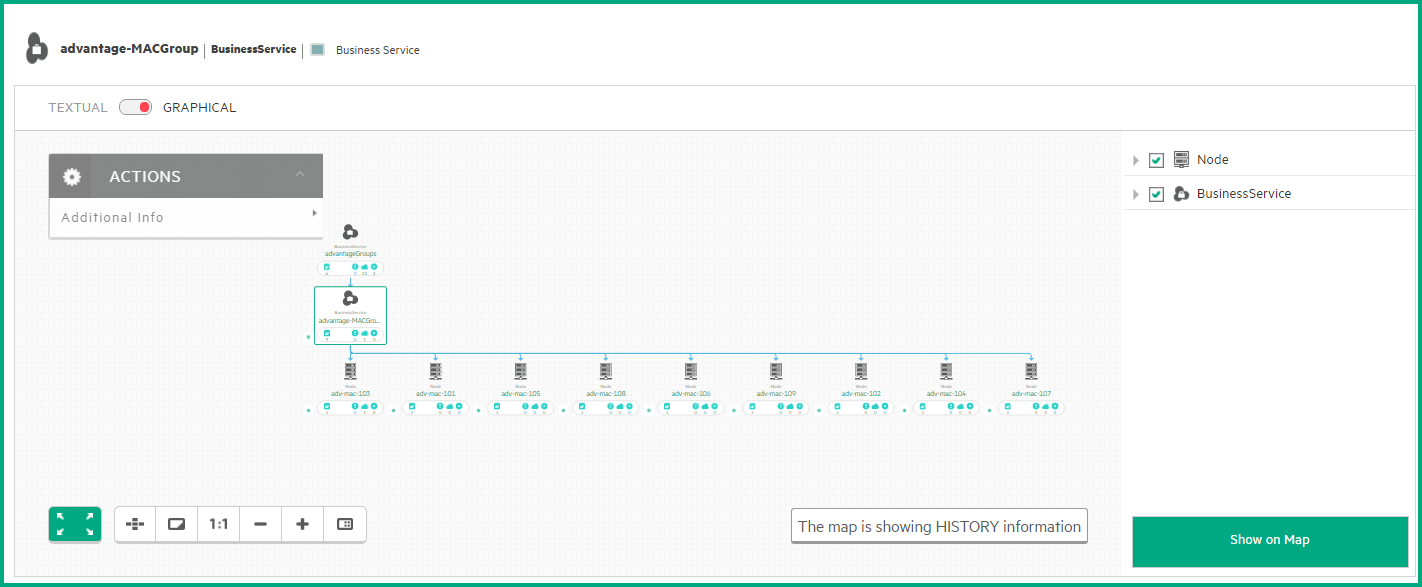
Only if an SMtoUCMDB integration instance is enabled in Service Manager (Tailoring > Integration Manager) and the Show UCMDB Browser CI Visualization widget option is enabled, Service Manager uses the Get Related widget from UCMDB Browser to visualize CI relationships. This enables users to use the same CI visualization on both product sides. For more information about the Get Related widget in UCMDB Browser, see UCMDB Browser Help Center (version 4.10 or later).
- For CIs that are not synchronized to UCMDB, for example, non-discoverable CIs, to show CI visualization using the embedded Get Related UCMDB Browser widget, it is recommended to set up an appropriate TQL script in UCMDB and then synchronize this kind of CIs to UCMDB.
- If there is no SMtoUCMDB integration instance enabled or the Show UCMDB Browser CI Visualization widget option is disabled in the integration instance, Service Manager uses its own CI visualization.
Service Manager users can access UCMDB Browser Get Related widget as described in the following table.
| Module | How to access |
|---|---|
| Incident |
|
| Interaction |
|
| Configuration |
|
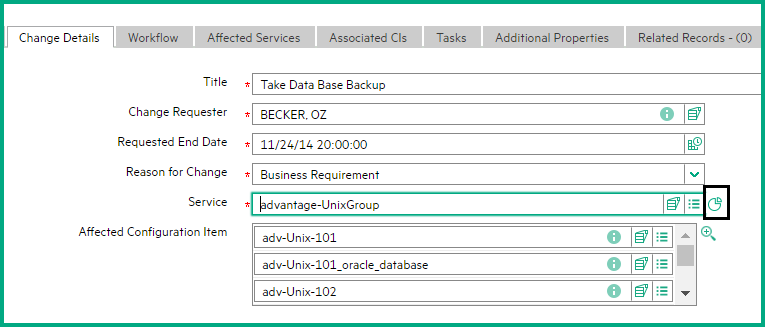
| Change or Change Task |
|
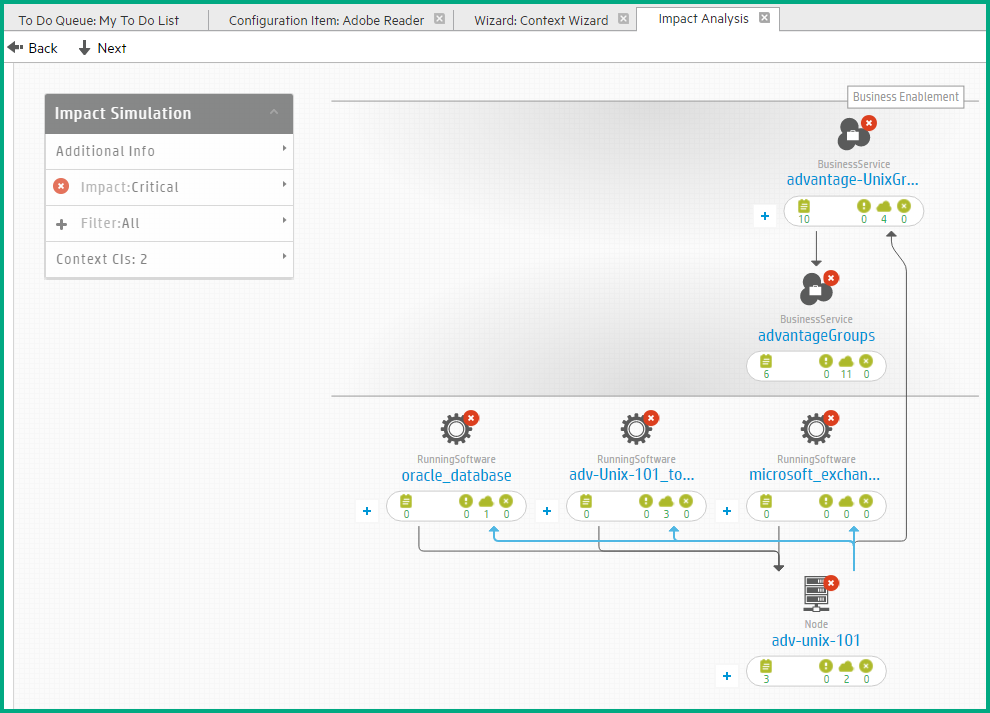
Impact Analysis
If an SMtoUCMDB integration instance is enabled in Service Manager (Tailoring > Integration Manager) and the Show UCMDB Browser Impact widget option is enabled, Service Manager users can access the Impact Simulation widget of UCMDB Browser, as described in the following table. Pay attention to the following:
- The Impact Simulation widget uses a default impact severity that is defined in the SMtoUCMDB integration instance. The out-of-box value is Critical. For more information, see How to Add UCMDB and UCMDB Browser Connection Information.
- UCMDB Browser uses blue lines and black lines to indicate different types of relationships. For more information, refer to the Service Modeling section in the Universal CMDB Browser Help Center.
Note If there is no SMtoUCMDB integration instance enabled or if the Show UCMDB Browser Impact widget option is disabled in the integration instance, the Visualize Impact button and Run Impact Analysis icon and menu option described in the following table are not displayed.
| Module | How to access |
|---|---|
| Incident |
|
| Interaction |
|
| Change or Change Task |
|