


Key capabilities
NNMi helps you monitor health and availability of physical and virtual devices and detect faults on your network. The NNMi Smart Plug-in add-on modules enhance NNMi’s capability to monitor specialized network environments, providing you with the information needed to identify and fix problems as they occur. This section helps you understand how NNMi helps you create a complete network monitoring solution with the following capabilities:
- Fault monitoring: Detecting, monitoring, consolidating, and correlating faults on your network.
- Alerting: Helping you monitor the health of your devices with the help of alerts in the incident views
- Topology discovery: Discovering and displaying device connectivity information with a powerful network discovery mechanism so that you can use to diagnose network problems
- Performance monitoring: Providing detailed reports on performance data to help you keep your network running smoothly for the long run.
Fault monitoring
NNMi uses several protocols to maintain communication channels with each managed device on your network. These include:
- SNMPv1, SNMPv2c, and SNMPv3
-
TCP/IP
-
UDP
- ICMP
- SOAP
NNMi's network management model consists of a network management server, managed nodes with agents, and a network management protocol. NNMi uses SNMP as its standard protocol, and uses this protocol to communicate over other protocols, such as ICMP and UDP. NNMi's network consists of at least one management server, a collection of SNMP agents, and network objects.
An SNMP agent, which resides on a managed node, is an application that acts on behalf of an object to perform network management operations requested by NNMi.
An object is anything that will be managed, such as a host, gateway, terminal server, hub, bridge, or switch.
The figure below shows a simplified diagram of the manager-agent interactions between NNMi and a managed node:
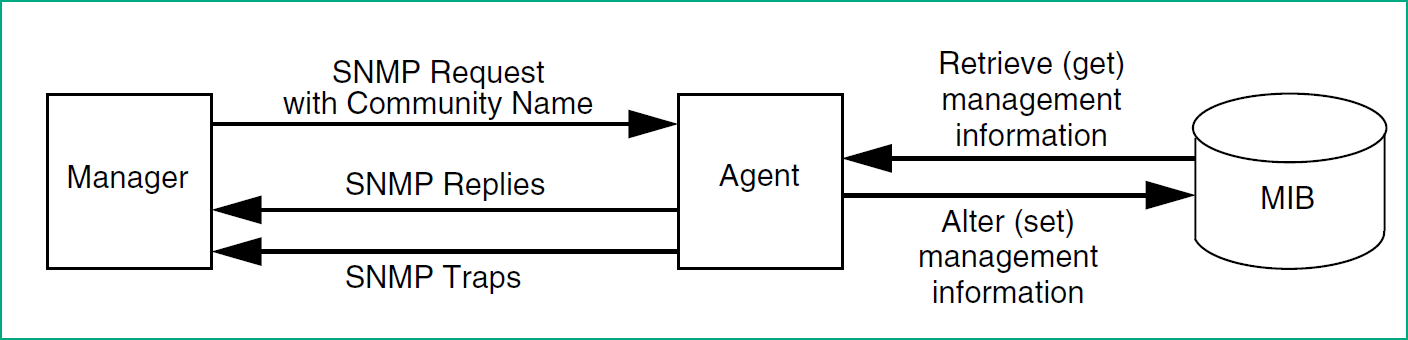
While discovering and monitoring virtual networks, NNMi connects to SOAP API libraries available on a hypervisor—also referred to as the Web Agent in this document—to gather similar information about virtual network devices.
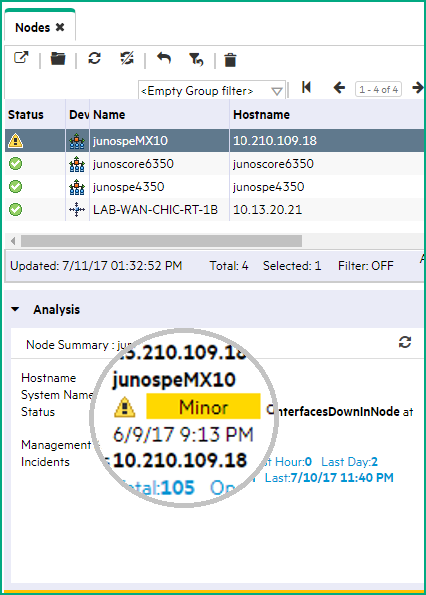
NNMi shows the status of all discovered devices in table views—also known as inventory views. Inventory views offer a quick way to determine the status of your network devices and associated interfaces. For more information about inventory views, see Learn Your Network Inventory.
Node Inventory View with the Status of Network Devices
Alerting
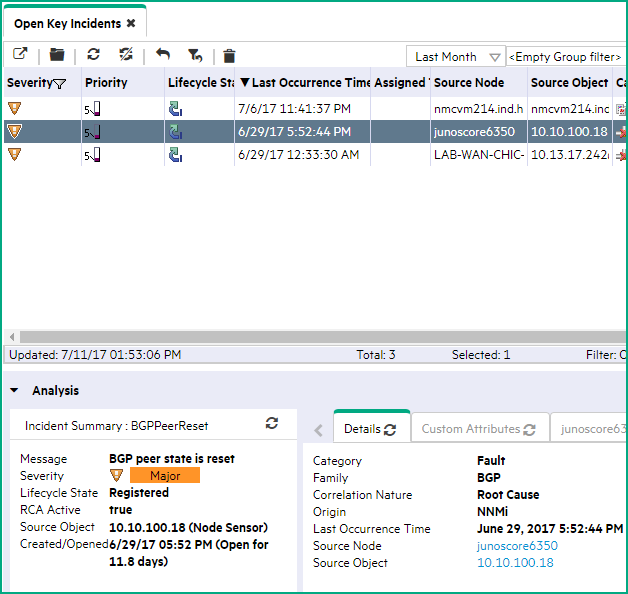
NNMi is specifically built for the exception-based management paradigm, which enables you to focus on priority tasks quickly. NNMi actively notifies you when an important event or incident occurs on the network. An incident can be triggered by a change in the status of a router or switch, a disruption in connectivity, or a non-responsive SNMP agents. Incidents are monitored by NNMi and reported through NNMi’s incident views.
You can browse through incidents to diagnose network problems. You can view incidents by specific node or other sort criteria to solve problems quickly. Every incident appears in the incident views with a default message, which can be customized, and can include helpful tips for resolving a particular network fault. Incident views offer a quick way to diagnose the problems detected by NNMi and finding a resolution to the problems. For more information about incident views, see Monitor Incidents for Problems.
Incident View with an Incident Triggered by the Status Transition of a Device
Topology discovery
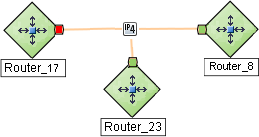
NNMi's network topology monitoring capability helps you diagnose network connectivity problems. NNMi can facilitate the monitoring of heterogeneous switched layer 2 and routed layer 3 environments with topology maps. A topology map indicates the status of a network node, interface, or network connection with colors (for example, green indicates the node is up) and is useful in performing the following tasks:
- Finding the cause of a connectivity problem (the device status is not Normal).
- Identifying the highly-connected nodes in your environment.
- Determining whether a subnet is down.
- Understanding the router connectivity between your devices.
- Understanding the switch connectivity between your devices.
For more information about topology monitoring, see View Maps (Network Connectivity).
Topology Map with Connectivity Status
Performance monitoring
NNMi assists you in figuring out how to fine-tune your network’s performance by collecting a rich set of performance metrics from devices and interfaces and presenting the metrics on easy-to-understand graphs, charts, and reports. Delivered with the NNM iSPI Performance for Metrics, NNMi's performance management capability continuously collects, stores, and manages performance-related metrics from across your network, store the data into a scalable database on the Network Performance Server (NPS)—the central component for building and viewing network reports, and provides you with seamless transitions from fault data to performance reports and back.
For more information about performance monitoring, see Monitor Performance with Network Reports.
Capabilities of the Network Node Manager i Software Smart Plug-ins
NNMi
Here is the list of NNM iSPIs that are available with NNMi
Network Node Manager iSPI Performance for Metrics Software (NNM iSPI Performance for Metrics)
The NNM iSPI Performance for Metrics provides the following software programs:
- Network Performance Server (NPS): NPS provides the infrastructure to analyze the performance characteristics of your network. With the performance data collected by the Network Node Manager i Software Smart Plug-ins (iSPIs), NPS builds data tables, runs queries in response to user selections, and displays query results in web-based reports that enable you to diagnose and troubleshoot problems in your network environment.
- NNM iSPI Performance for Metrics: The NNM iSPI Performance for Metrics provides the core performance management capability to NNMi by gathering and monitoring the metric data polled by NNMi from different network elements. The combination of NNMi and NNM iSPI Performance for Metrics enables you to monitor the operational performance of your network infrastructure.
The NNM iSPI Performance for Metrics also provides you with sets of embedded dashboard screens and predefined reports in the form of Extension Packs to analyze the performance data polled by NNMi.
Network Node Manager iSPI Performance for Quality Assurance Software (NNM iSPI Performance for QA)
The NNM iSPI Performance for QA monitors the quality of network service levels discovered by NNMi to ensure network services are performing to the desired levels.
The NNM iSPI Performance for QA also provides the Intelligent Response Agent (iRA), which monitors performance of such response probes on the Windows and Linux systems that NNMi is managing. This allows for more precise source-to-destination tests and prevents additional load on critical network devices.
Network Node Manager iSPI Performance for Traffic Software (NNM iSPI Performance for Traffic)
The NNM iSPI Performance for Traffic tracks and reports on all network traffic in an enterprise that is being collected via the industry-standard NetFlow, JFlow, SFlow, and IPFIX traffic data capture methodologies. It provides aggregated and detailed reports on the volume of traffic flowing between host servers, which can be scoped by individual router interfaces. It can characterize all applications in the system by means of powerful configurable rules and thus presents an integrated view of packet flow in the network.
Network Node Manager iSPI for IP Multicast Software (NNM iSPI for IP Multicast)
The NNM iSPI for IP Multicast extends NNMi to be aware of IP multicast environments. It improves fault isolation for IP multicast applications by automatically discovering and displaying views of multicast nodes and interfaces and their relationships, as well as generating alarms based on events related to the multicast environment.
Network Node Manager iSPI for MPLS Software (NNM iSPI for MPLS)
The NNM iSPI for MPLS monitors multiprotocol label switching (MPLS) service availability and inventory. In addition to traditional Layer 3 virtual private networks (L3 VPN), the NNM iSPI for MPLS handles core, traffic-engineered, and pseudo-wire management (L2 VPN).
Network Node Manager iSPI for IP Telephony Software (NNM iSPI for IP Telephony)
NNM iSPI for IP Telephony provides comprehensive fault and availability management of your business-essential IP telephony service. This iSPI provides discovery and in-depth monitoring for the critical IP telephony infrastructure, including gateways, gateway endpoints and channels, gatekeepers, and IP phones. It also improves efficiency by giving telecom and data teams a common diagnostic and monitoring solution. The NNM iSPI for IP Telephony supports Avaya, Cisco, and Nortel IP telephony systems.
Network Node Manager iSPI Network Engineering Toolset Software (NNM iSPI NET)
NNM iSPI NET delivers key tools and workflow automation for network engineers and operators. It provides workflow automation from an embedded limited-use version of Operations Orchestration software. The NNM iSPI NET also provides trap analytic capabilities and topology export to Microsoft Visio. Both the tools and the workflow automation save operators and engineers time when it is most valuable—during a problem—resulting in faster repairs and less downtime.