


Work with Objects
Objects are database records of information about your environment and events that occur within it. Each type of object represents a particular kind of information. For example, incident objects represent situations or events that arise in your environment. This topic includes the following attributes:
- Access a Subset of the Available Information About a Related Object
- Access All Information About a Related Object
- Modify Object Attribute Values
- About the Analysis Pane
An object is defined by its attributes. For example, an incident object includes a status attribute and a source node (among many others). Different object types have different amounts and types of attributes. Some attribute values are simple things, such as numbers and text strings. Other attribute values are more complex, such as a reference to a related object. For example, when an SNMP Agent attribute appears in a Node form, it represents the SNMP Agent that is related to the selected node.
If more than one of a certain type of object can be related to the selected object (for example, incidents related to a node), the form contains a tab that displays a table with the entire list of related objects.
A view is a collection of related objects that are depicted graphically as a table or map. A form provides all stored attributes about a selected object. The attributes on the form can be attributes of the selected object or related objects.
Operations that can be performed on objects are called actions. Actions are simply shortcuts to simple or complex tasks. A particular action can be associated with a specific object type. For example, when displaying a node table view, you might want to open a map showing all of that node's Layer 2 neighbors.
You can also right-click any object in a table or map view to access the items available within the Actions menu.To access an object's form from a table view:
Double-click the row representing an object.
NNMi displays the form for the selected object.
To access an object's form from a map view:
Do one of the following:
- Select the node of interest and click the
 Open icon.
 In most cases, double-click the object of interest.
If the map object is a Child Node Group, double-clicking the Child Node Group object replaces the current map with a map of the nodes in the Child Node Group. To access a Child Node Group form, select the Child Node Group object and click the
Open icon. See "Help for Operators" for more information.
NNMi displays the form for the selected object.
A red asterisk (*) that precedes an attribute on a form indicates the attribute requires a value.From an object form, you can:
Modify Object Attribute Values
Access All Information About a Related Object
Access a Subset of the Available Information About a Related Object
Access a Subset of the Available Information About a Related Object
While investigating the available information for an object (within that object's form), some information represents attributes of the object itself and some information is about related objects. The related objects are indicated by a  Lookup icon. For example, when viewing information for an Interface object, you can access information about the Node in which that interface resides.
A red asterisk (*) that precedes an attribute on a form indicates the attribute requires a value.
This is an example Lookup Field:

To display a subset of information about a related object from within a form:
- Locate the field for the related object that you want to learn more about.
- Click the Lookup icon, and select
 Show Analysis from the drop-down menu.
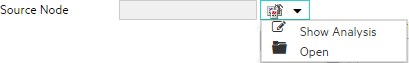
The Analysis Pane appears showing information about the related object. See About the Analysis Pane for more information.
NNMi displays only the information that the NNMi Security configuration permits you to access. See Determine which NNMi Role to Assign in "Help for Administrators" for more information.
Mouse-over any
 Refresh icon to see the last time the details were updated.
 Click any
Refresh icon to gather the most recent data.
Access All Information About a Related Object
While investigating the details for one object using a form, you can access information about another related object. For example, when viewing all information stored for a node, you can access all available information for an interface for that node to determine the interface status.
A red asterisk (*) that precedes an attribute on a form indicates the attribute requires a value.
You can open another form from within a form for any object that is contained in the form you are viewing. Such objects are indicated using a Lookup icon.
This is an example Lookup Field:
To open another form from within a form:
- Locate the field of an object about which you want to see more information.
- Click the Lookup icon, and select Open from the drop-down menu.
A new form appears showing all of the attributes for that object. Any default values specified for the object are pre-populated in the form
Modify Object Attribute Values
When viewing details for an object, such as a node, subnet, or interface, you can change one or more of its attribute values. For example, you can add notes to an incident to explain steps that were taken to date to resolve the problem. Until the problem is resolved you can enter information related to a workaround. Finally, after a solution is determined, you can add information describing how the problem was resolved.
If you have Guest user role, you cannot modify any attributes.
Two kinds of fields indicate that you can modify an attribute.
A red asterisk (*) that precedes an attribute on a form indicates the attribute requires a value.
To modify information in a text box:
- Move your cursor to the modifiable field of interest.
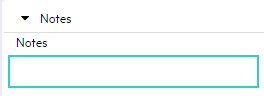
Type the new value. For example, the Notes attribute is a modifiable field:
If the attribute appears to be a modifiable field, but it does not permit text entry, it is a memo field.
Click the attribute label to access a dialog box that enables you to view or edit text. Using this feature, you can insert more text or view a text field that is longer than the original display area.
When you are finished with your edits:
- Click
 Save to save your changes.
 - Click
 Save and Close to save your changes and close the form.
- Click
To modify information in a Lookup field:
- Look for this icon to the right of a text box . For example:
Do one of the following:
- Start to type into the text box. NNMi displays a list of all valid choices. You can select from the list to complete your choice.
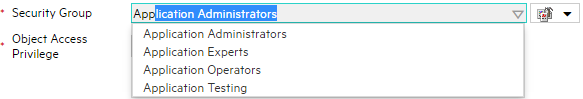
- Click the Lookup icon, and choose
 Quick Find to display a list of valid choices:
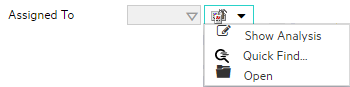
- Start to type into the text box. NNMi displays a list of all valid choices. You can select from the list to complete your choice.
When you are finished with your edits:
- Click Save to save your changes.
- Click Save and Close to save your changes and close the form.
- Click
About the Analysis Pane
The Analysis Pane displays related details about the selected object. NNMi performs the appropriate analysis on the selected object to determine the most important information to display. Any hyperlink within the Analysis Pane displays more information about the selected detail.
For example: When you select an Incident, the Analysis Pane might include important details about the incident's Source Node and Source Object. When you select a Node, the Analysis Pane might include important information about the node's Interfaces and IP Addresses.
Access the Analysis Pane from a table view:
- Select the workspace of interest (for example,
 Inventory).
 - Select the view that contains the object of interest (for example, the Nodes view).
- Select the row that contains the object of interest.
- NNMi displays detailed information at the bottom of the view in the Analysis Pane.
- Select the workspace of interest (for example,
Access the Analysis Pane in a map view:
- Select the workspace of interest (for example,
 Topology Maps).
 Select a map view (for example, select Routers).
If the map requires a starting node before it opens, enter the name or IP Address for the starting node you want to use.
- Click the map object of interest.
- NNMi displays detailed information at the bottom of the view in the Analysis Pane.
- Select the workspace of interest (for example,
Access the Analysis Pane in a form:
Click the form's toolbar
Show Analysis icon to display information about the current form's top-level object in the Analysis Pane. Show Analysis always displays the top-level object's information.- Click a row in a table on one of the form's tabs to display detailed information about the selected object in the Analysis Pane.
NNMi displays detailed information at the bottom of the form in the Analysis Pane. See Working with Objects for more information about forms.
Open the Analysis Pane if necessary by clicking the
 expand button in the Analysis Pane banner bar:
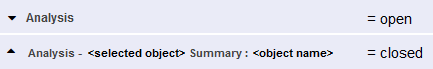
If you change views, NNMi clears the Analysis Pane. The Analysis Pane remains blank unless an object is selected.
If you select multiple objects, the Analysis Pane displays data about the first selected object.
Using the Analysis Pane:
- To resize, place your mouse cursor over the title bar to display the ↕ symbol and drag to adjust the size.
To refresh a subset of information in the Analysis Pane, click any displayed
Refresh icon .To refresh all data in the Analysis Pane, open the object's form and click
Refresh or Save.- To launch an SNMP Line Graph for the selected metric, click the icon that appears at the bottom of each gauge.
- To select and copy the tooltip information, double-click the gauge. NNMi opens a text window that enables you to select and copy the tooltip information.
The Gauges tab shows real-time SNMP gauges to display State Poller and Custom Poller SNMP data.
- These gauges are displayed for Nodes, Interfaces, Custom Node Collections, and for Node Sensors of type CPU, Memory, or Buffers, and Physical Sensors of type Backplane.
NNMi displays a gauge for each significant MIB Object Identifier (OID) that the node or interface supports, up to the default maximum of 24.
Each gauge displays the current OID value, using the default refresh rate of 15 seconds.
- The value range displayed indicates the OID minimum and maximum values that NNMi has encountered.
- For any gauge that tracks percentage values, NNMi uses a red line to indicate where the OID value is near 100 percent.
There is not a one-to-one match between the OIDs used to analyze monitoring thresholds and those displayed in the Analysis Pane. For example, the Analysis Pane might display a Cisco Memory Pool OID value that does not match the value used to calculate whether the Memory Utilization Monitored Attribute threshold is reached or exceeded. This is because some threshold metrics require more complex calculations than a single OID allows.
If a gauge label appears to be a duplicate value, mouse over the label to view the more complete tooltip name that appears.
Some views are also accessible from the console's Actions menu. See Use Actions to Perform Tasks for more information. You can also right-click any object in a table or map view to access the items available within the Actions menu.
For more information about the types of information displayed, see Use the Analysis Pane.