


NPS Administration
NPS uses NNMi for all user authentication and logon via Single Sign-On. NNMi users automatically become NPS users the first time they access the NPS Report Menu.
NNMi user roles are applied in NPS. An NNMi administrator is automatically granted administrative privileges on NPS. These privileges include the ability to administer and manipulate content and settings on the BI server.
Single Sign-On Security
NPS enables you to use a security function known as Single Sign-on (SSO). SSO allows NPS to recognize the same user names and passwords the NNMi console recognizes. When SSO is enabled, a user who is already logged on to NNMi can move from NNMi to a report without having to log on again.
For SSO to operate, the following conditions must be met:
- The NNM system and the NPS system must be configured with fully qualified domain names (FQDN).
- The user must use the fully qualified domain (not "localhost" or the machine name without the domain) when launching the NNMi console.
If the user launches NNMi using an unqualified host name, an error message will appear in the Current Status tab of the navigation panel.
If the address, or the domain, of the NNMi management server or the NPS system changes after you install NPS, re-run the enablement script on NNMi. Re-running the enablement script configures NNMi with updated location information.
Direct access to NPS
You can access NPS directly, without going through NNMi, by pointing your browser at:
http://<fully-Qualified-serverName>:9300
When the login window opens, enter the same username and password you use to launch NNMi. After you are authenticated, the NPS home page opens.
You can also use the following method:
From the server where NPS is installed, run launchReport.ovpl.
Monitor NPS Processes
NPS includes reports for admin users only to monitor NPS processes.
To view the available reports:
- Log on to NPS.
- On the NPS home page, click the Reports tab in the navigation panel.
- Select Self Monitoring(admin users only) > PerfSPI_Diagnostics > DiagnosticMetrics.
Location of Program and Runtime Files
NPS consists of static application software files and dynamic runtime files.
The default path for static application software is:
-
Windows:
C:\Program Files (x86)\HP\HP BTO Software\NNMPerformanceSPI
-
Linux:
/opt/OV/NNMPerformanceSPI
The default path for the dynamic runtime files is:
-
Windows:
C:\ProgramData\HP\HP BTO Software\NNMPerformanceSPI
-
Linux:
/var/opt/OV/NNMPerformanceSPI
The performance of NPS depends on the I/O performance of the disk subsystem where this directory resides. strongly recommends that this data location be hosted on a high-performance file system. For specifications, see the support matrix.
The NNMPerformanceSPI directory contains the following folders:
- contentstore
- database
- nnmappfailover
- L10N
- logs
- PerfSPI_Diagnostics
- rconfig
- A directory for each installed Extension Pack
- Additional directories for any Custom Collect Report Groups created on NNMi
The folders are placed by the default NPS installation. Additional folders can be present if additional Extension Packs are present.
Data Retention Defaults
The default settings are the following:
| Setting | Default Value (Days) | Table |
|---|---|---|
| Daily Data | 800 | Day |
| Hourly Data | 70 | Hour |
| Raw/Detailed Data | 14 | Raw |
You can modify the default settings using the Configuration Utility
Set Thresholds for Metrics in NNMi
Until you set the thresholds, you cannot track exception counts with the help of reports.
NNMi does not set thresholds for performance metrics for you automatically. You must set the thresholds for the NNMi manually using the Thresholds Settings form in the NNMi console. You can set thresholds for the following metrics:
- Discard rate in
- Discard rate out
- Error rate in
- Error rate out
- Utilization in
- Utilization out
- CPU 5 second utilization
- CPU 1 minute utilization
- CPU 5 minute utilization
- Memory utilization
- Buffer utilization
- Buffer miss rate
- Buffer failure rate
For information about how to set thresholds using the NNMi console, see Configure Threshold Monitoring for Interfaces ( Network Node Manager iSPI Performance for Metrics Software) in the Network Node Manager i Software Online Help for Administrators.
Although you might want to see exception counts as soon as possible, setting thresholds right away might not be feasible. You might want to wait until you are better acquainted with the way your network behaves. If you set thresholds prematurely, you might experience problems. For example, if the thresholds are wrong, NNMi might detect too many exceptions. Or, if you configure NNMi to generate incidents in response to threshold conditions, NNMi might generate too many incidents.
NNMi Baseline Settings
You can use configure NNMi and NPS for baseline monitoring in your network environment. For more information, see the "Configure Baseline Settings" topic in the Network Node Manager i Software Online Help for Administrators.
Definition of Threshold Terms
- High Value (HV): Any value above this value is in the high range; any value in the high range triggers a High status.
- High Value Rearm (HVR): Any value below High Value; indicates that the High status has ended.
- High Trigger Count (HTC): The number of consecutive polls a high value must remain the same before the status changes to High. A trigger count of 1 is usually appropriate.
- Low Value (LV): Any value below this value is in the low range; any value in the low range triggers a Low status.
- Low Value Rearm (LVR): Any value above Low Value;indicates that the Low status has ended.
- Low Trigger Count (LTC): The number of consecutive polls a low value must remain the same before the status changes to Low. A trigger count of 1 is usually appropriate.
- Duration: The time limit before which the baseline metric state cannot change to Abnormal Range or generate an incident. This time period specifies the minimum time within which the metric value must remain out of the configured Baseline Range.
- Duration Window: The window of time in which the Upper Baseline Limt or Lower Baseline Limit criteria must be met.
Configure NPS
If you install NPS on the NNMi management server, configuration takes place automatically during the installation. After installation, you can use the Configuration utility to make changes.
If you install NPS on a dedicated server, you must use the Configuration utility to specify configuration details. At the end of the installation, before the NPS ETL services are started, the Configuration utility asks you necessary configuration details.
To launch the Configuration utility, run runConfigurationGUI.ovpl.
You can use the Configuration utility to specify the following values.
Configure the iSPI Performance service to log on as:
Windows
-
When NPS is installed on a dedicated Windows server, you must select Remote CIFS Share Access. For detailed instructions, see the Installing NPS section of the Network Node Manager iSPI Performance for Metrics Interactive Installation Guide.
You must provide the same account information that was used with the
nnmenableperfspi.ovplscript on the NNMi management server. -
When NPS is installed on the Windows NNMi management server, you must select Local Path or NFS Share.
Linux
-
When NPS is installed on a dedicated Linux server, you can select Remote CIFS Share Access or Local Path or NFS Share depending on the configuration provided with the
nnmenablementperfspi.ovplscript. -
When NPS is installed on the Linux NNMi management server, you must select Local Path or NFS Share.
Specify the path to iSPI Performance data files folder:
-
If NPS is installed on the NNMi management server, a local path is displayed in this field. You must not change this value.
-
If NPS is installed on a dedicated server, the
nnmenableperfspi.ovplscript creates a shared space on the NNMi server.You must specify the location of the shared space in the correct format.
Details provided during the last run of the
nnmenableperfspi.ovplscript are captured in thennmenableperfspi.txtfile, which is available in the following directory on the NNMi management server:On Windows
%nnmdatadir%\log
On Linux
/var/opt/OV/log
Daily Data Retention Period (days)
The default setting is 800.
Hourly Data Retention Period (days)
The default setting is 70 days.
The maximum retention period is 400 days.
Raw/ Detailed Data Retention Period (days)
The default setting is 14 days.
The maximum retention period is 400 days.
Service status:
Click Stop or Start to stop and start necessary NPS processes.
If you change any of the default settings, click Apply, click Stop, click Start, and then click Exit.
To retain the originally configured settings, click Exit.
Master Runtime Configuration File NNMPerformanceSPI.cfg
The NNMPerformanceSPI.cfg file controls the operation of the iSPI Performance
for Metrics.
The file contains values written by the Configuration Utility, as well as many other options with their standard and recommended settings.
User Groups and Security Groups in NPS
Both NNMi and NPS restrict access to data based on user/UserGroup/SecurityGroup/node mappings.
User Groups and Security Groups are created by NNMi administrators. For each user, NPS filters the data queries for all reports and ad hoc queries, so that the user has access only to data for managed nodes whose Security Groups are associated with the User Groups to which the user belongs.
NPS data security restricts all data access according to the following policies:
- Filter the fact table queries for all report graphs and tables, including reports created using Query Studio.
- Filter the dimension data queries used in topology filter prompts or in Query Studio.
- Filter group member queries used in topology filter prompts or in Query Studio. NPS does not display data related to the groups, where none of the members have access to the report data.
The NNMi built-in User Groups "NNMi Administrators (admin)" and "NNMi Global Operators (globalops)" are automatically granted visibility to all performance data regardless of security group assignments. All users who are assigned to either the NNMi admin or globalops User Group have full access to all data in reports and queries.
Members of the "NNMi Administrators (admin)" User Group are granted full administrative privileges to the NPS BI Server, and have unfettered rights to save, move,delete content (including content created or owned by other users), and perform other administrative tasks.
Members of the "NNMi Global Operators (globalops)" User Group are granted read-only access to all data, including reports and queries saved by other users, but do not have administrative capabilities on the NPS BI Server and cannot modify the content of public folders or other User Group folders.
Example
Say that NPS data is divided among the following locations:
- Site A
- Site B
And each location includes the following local users:
- Operator 1: This user can access data for only Site A.
- Operator 2: This user can access data for only Site B.
The following global users can access data from all locations:
- Admin: The NNMi and NPS Administrator administers both locations and accesses NPS data from all locations.
- GlobalOperator: The user for both Site A and Site B must access NPS data in both locations.
Once the administrator (Admin in this example) creates these User Groups in NNMi, NPS ensures that access to NPS features and data is restricted according to the privileges defined for each User Group.
| User Account | NPS User Group | NPS Access Privileges |
|---|---|---|
| Admin | NNMi and NPS Administrator |
|
| GlobalOperator | Global Operator | Can generate reports for all sites, including Site A and Site B |
| Operator 1 | Level 1 Operator | Can generate reports for only Site A |
| Operator 2 | Level 1 Operator | Can generate reports for only Site B |
For more information on configuring User Groups, see "Configuring Security" in the Network Node Manager i Software Online Help for Administrators.
Check the Validity of NNM iSPI Performance Configurations
The Configuration Checker enables you to verify the validity of the configuration file entries. It displays the following message if all the entries are valid:
INFO: Configuration File Validated OK
To launch the Configuration Checker, run runCheckConfig.ovpl.
Reset NPS
The reset utility enables you to delete all data from the database with the following options:
- Keep all archived data.
- Restore archived data for re-processing.
- Delete all archived metrics/topology.
- Delete all archived data and log files and restart all services.
- Delete all archived data and recreate the database with the default size, location, and options.
To launch the NPS Reset utility, run resetSPI.ovpl.
The Reset Utility window displays the following options:
1. Delete all data from database, & keep all archived data
2. Delete all data from database, & restore archived data for re-processing
3. Delete all data from database, & delete all archived metrics/topology
4. Delete all data from database, delete all archived data and logfiles, & restart all services
5. Delete and recreate entire database using default size, location, and options
Enter Option (1-5), or Q to quit:
Collect Diagnostic Data for Support
The Diagnostics Collector utility enables you to collect diagnostic data for Support. The data will be used to to diagnose the problem.
To launch the Diagnostics Collector, run collectDiagnostics.ovpl.
The Diagnostics Collector saves the output in the form of a compressed tar.gz file in the following location:
-
Windows:
%NPSDataDir%\
collectDiag -
Linux:
/var/opt/OV/HPNNMPerformanceSPI/collectDiag
Forward the tar.gz file from the collectDiag folder to Support.
Analyze Log Files
The Log File Analyzer enables you to view the following:
- A daily summary of errors, warnings, and other notifications produced by each process within each Extension Pack
- Timing data for selected processes belonging to each Extension Pack
- Timing data for generating reports for different Extension Packs
The Log File Analyzer analyzes the prspi.log and
PerfSPI_Diagnostic_Metrics.log files.
To launch the Log File Analyzer, run log_analyzer.ovpl.s
Warnings, Errors, and Other Notifications in iSPI for Performance Log Files
Summary data for warnings, errors, and other notifications covers the previous two weeks. The last summary covers today. The summary for today is incomplete until midnight. Summary data indicates the following:
- Date
- Number of errors per process, if any
- Number of warnings per process, if any
- Number of processes with fatal errors, if any
Here are examples:
prspi.20080729.log:
WARN  - 240 in ETL.Component_Health
WARN  - 268 in ETL.Interface_Health
WARN  - 285 in MainServiceLoop
ERROR - 2 in MainServiceLoop
prspi.20090915.log:
WARN  - 27 in ETL.Interface_Health
WARN  - 714 in MainServiceLoop
FATAL - 1 in Utility.startBI
FATAL - 152 in ETL.Interface_Health
FATAL - 1 in Utility.installExtensionPack
A warning normally indicates a transient condition, usually a temporary mismatch, that will self-correct. If you see a warning message or a fatal error message, you can examine it in more detail by viewing the associated logfile in a text editor.
The last log in the list is today's partially complete log. This
partially complete log does not have a date attached to it. The file name for
today's log is prspi.log
View Timing Data
Under the summary of all warnings and errors, if you press Enter, you can continue to see the timing data.
The timing data shows the following:
- Total number of times a process executed over the previous two weeks
- Average execution time per process over the previous two weeks and standard deviation
- Maximum execution time per process over the previous two weeks
- Average number of records processed per execution
- Average number of records processed per second
Monitor Log Files
The log file viewer is Chainsaw 2.0. With Chainsaw, you can monitor DEBUG, INFO, WARN, ERROR, and FATAL messages as they reach the prspi.log file. The file contains every message generated since the previous midnight. The path to the file is:
-
Windows:
%NPSDataDir%
\logs -
Linux:
/var/opt/OV/NNMPerformanceSPI/logs
To launch the Log File monitor, run runChainsaw.ovpl.
Use the Chainsaw Message Interface for the NNM iSPI Performance
The welcome page includes several tabs. To open the message interface, click the NNMPerformanceSPI/logs/prspi.log tab.
The Chainsaw message interface displays the following panes:
- Event pane
- Detail event pane
- Tree logger pane
The event pane changes constantly, displaying the most recent message in prspi.log. Additional information about that message appears in the detail event pane. When you select an older message in the event pane, the detail event pane refreshes with additional information about that message.
The detail event pane indicates the following:
- Level
- Logger
- Time
- Thread
- Message
- NDC [null]
- Class [not used]
- Method [not used]
- Line
- File
- Properties
- Throwable [not used]
The logger tree pane shows the Root Logger folder.
The ETL folder, which appears under the Root Logger folder, contains three logger folders, one for each standard Extension Pack. An additiional logger folder appears for any additional Extension Packs that are installed.
New messages generated by the logger folders appear once every few seconds in the event pane. To see messages for one logger only, type that logger name in the Refine focus on field; for example:
Refine focus on:Interface_Health
You can expand the event pane by closing the logger tree pane and the detail event pane.
Chainsaw version 2.0 features enable you to:
- Fully customize each tab.
- Control the frequency of updates.
- Specify your own rules for color-coding events (the defaults are yellow for WARN, red for ERROR).
- Apply simple filters, or advanced expression-based filters.
- Save memory by setting a cyclic-based view that looks at X events only.
For more information about Chainsaw, run the tutorial under the Help menu or go to
http://logging.apache.org/chainsaw/quicktour.html
Custom Poller
NNMi's Custom Poller feature uses SNMP MIB variables to gather additional device information that is useful in managing your network. The Custom Poller enables you to:
- View the list of topology nodes for which additional information is being polled as well as the name of the associated Policy.
- View the polling results. The first time the results for a specified MIB variable are discovered, the results appear in a Polled Instance object. The Polled Instance object is updated whenever a change in State is detected and includes the most current polled value that caused the State to change.
- View incidents that are generated by Custom Poller for a MIB Poll Variable.
For example, as an administrator, you could have NNMi monitor the Status of COM (communication) ports on all of your Windows servers. You could also configure NNMi to send incidents when certain MIB values are detected. Or to map returned MIB values to States and include those States as part of the node Status calculations.
As an operator, the Custom Poller enables you to:
- View the list of topology nodes for which additional information is being polled as well as the name of the associated Policy.
- View the polling results. The first time the results for a specified MIB variable are discovered, the results appear in a Polled Instance object. The Polled Instance object is updated whenever a change in State is detected and includes the most current polled value that caused the State to change.
- View incidents that are generated by Custom Poller for a MIB Poll Variable.
You can use the data collected by Custom Poller collections to construct and view reports using the iSPI Performance for Metrics.
Overview of Custom Poller Collections and Their Associated Policies
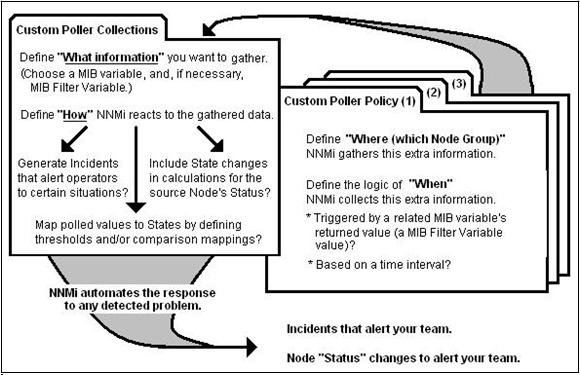
See the NNMi online help for more information on the Custom Poller feature.
Reports for Custom Poller Collections
You can configure the NNMi to create reports based on the data collected by NNMi's Custom Poller. The Report Groups tab in the Custom Poller Configuration form enables you to generate reports from the metrics obtained from Custom Poller collections.
The NNMi creates new Extension Packs to display reports generated from the data collected by Custom Poller collections.
To create Custom Poller collection and report groups, follow the instructions in the Create Custom Polling Configurations sections in NNMi Help for Administrators.
Guidelines to Creating a Custom Poller Extension Pack
- You can associate a Custom Poller Collection with only one report group.
- If you associate more than one Custom Poller Collection with the same Report Group, make sure the combination of Collections generates a meaningful report. Select Collections whose MIB Variables represent the same index value across Custom Poller Collections.
- Avoid using keyboard symbols while naming the Custom Poller collection and customPoll OID. The symbols
<,>,”,’,&,\are replaced by a ! character on the report. - Reports are not created if the name of the Custom Poller includes the # symbol.
- You cannot rename a Custom Poller Extension Pack.
Remove Custom Poller Extension Packs
You can use command line tools to remove Custom Poller Extension Packs.
To remove Custom Poller Extension Packs:
In a distributed deployment of NPS, follow these steps only the system with the ETL Server role.
In an environment with multiple ETL Servers, follow these steps only on the ETL Server where you installed the Custom Poller Extension Pack.
For more information about these environments, see theNNMi Deployment Reference.
- Log in with administrative or root privileges to the system where NPS is installed.
-
To view the list of Extension Packs, run:
uninstallExtensionPack.ovpl -
To delete a specific Extension Pack, run:
uninstallExtensionPack.ovpl -p <extension_pack_name>
You cannot recover the data associated with an Extension Pack if you inadvertently delete it. Make sure to type the correct Extension Pack name with the command. Do not delete the following default Extension Packs unless you want to remove iSPI Performance for Metrics reports: Interface_Health, Component_Health. If you delete the PerfSPI_Diagnostics Extension Pack, you will not be able to monitor the health of NPS processes.
Modify Topology Attribute Values and Group Memberships from NNMi
The topology attributes and groups help you filter the data and build the report with data polled from the nodes and interfaces you select. NPS retrieves the topology attribute details from NNMi and other iSPIs. If you make modifications to topology attributes and group memberships from NNMi, the changes are reflected in NPS within about an hour.
Changes are not applied retroactively to the existing data. Changes are always forward-looking. NPS preserves the historical accuracy of the data as it was when it was collected.
For example:
- If a new node is added to a group, it is only added for the new data collected going forward. NPS cannot assume that the node was a member of the group in the past.
- If an interface attribute changes—for example, if speed is changed from an old to a new value—the change is applied going forward. NPS does not assume that the new speed applies to the historical data.
If you delete or change a member of a topology attribute, the old member continues to appear in the list of topology filters in NPS. The old attribute member continues to appear in the list of topology filters. If you select the old member, the data collected before making the change gets sampled in the report.
Example
Say you modify node group name A to node group name B in the NNMi console. The new node name will appear in NPS after an hour or so. Later, the old node group name will continue to appear in the list of node groups in the Topology Filters section. But, if you select A, you will not be able to retrieve data samples associated with A that are polled after the node group name was changed to B.
Suppose you had an interface group called Oracle Server Ports that identifies switch interfaces assigned to your Oracle Server cluster, but now you have a new server cluster available online. You decide to transfer your Oracle applications to the new one and re-purpose the old servers to host the Microsoft Exchange Server.
You therefore rename Oracle Server Ports to Exchange Server Ports and create a new interface group for Oracle Server Ports identifying the ports associated with the new servers. If you run a report at the end of the month to see the health of your Oracle Server Ports and your new Exchange Server Ports, NPS will define an Oracle Server Ports group to include the data collected for the original ports up to the time you made the change and for the new ports after that.
Likewise, NPS will define the Exchange Server Ports group to only include the ports from the time the group was renamed. It will not include the ports while they were still being used for Oracle.
Set Polling Characteristics in NNMi
Performance polling impacts NNMi and your network. If you enable additional performance polling, NNMi must allocate a portion of its resources to handle the additional polling. Your network must accommodate an increase in SNMP traffic. To use the system and network resources wisely, limit performance polling to the devices you require the most.
By default, NNMi enables performance polling for the following Node Groups:
- Network Infrastructure Devices
- Routers
The following are some of the ways you can modify the performance polling defaults that will be in place right after the iSPI is installed:
- Set thresholds for a node group you are already polling for performance data (no thresholds are set by default).
- Modify the frequency of performance polling.
- Add nodes to the Important Nodes group, and enable performance polling for this group.
- Enable performance polling for the Microsoft Windows Systems group.
All these processes involve monitoring configuration tasks. Monitoring configuration tasks are related to polling.
For information about any of these processes, see the NNMi Help for Administrators.
iSPI Performance BI Server Portal
The iSPI Performance BI Server Portal enables you to perform the following tasks:
- Open Public Folders and access reports from BI Server Connection.
- Open My Reports and view reports with the filter preferences you saved.
-
Set up the following preferences:
- Set up the display parameters for the reports.
- Select the report format
-
Set up a schedule for running summary reports.
To be able to schedule reports in the NPS console, you must log on to NNMi as an administrator or Level 2 operator.
- Set up email report delivery.
- Modify BI Server tuning parameters for large multi-user installations.
- Select language for your reports
- Create custom reports using Query Studio.
Launch the iSPI Performance BI Server Portal
To launch the iSPI Performance BI Server Portal:
- Log on to NPS as Administrator.
-
On the navigation panel on the NPS home page, click BI Server.
-
Click Portal.
Optionally, you can start the iSPI Performance BI Server Portal as follows:
- Go to http://<localhost>:9300/p2pd/NPS.html.
- On the login page, enter your ErsAdmin user name and password.
Create a New Folder in the BI Portal
To create a new folder in the BI Portal:
- In the NNM iSPI Performance BI Portal, click
 New Folder.
- In the New Folder Wizard form, specify the name, description, and location for the new folder.
- Click Finish.
BI Server Documentation
To access the BI Server documentation, click  Help on the BI Server Portal.
Change Report Format Preferences
The default report format used by NPS and the BI Server is HTML.
You can set the iSPI Performance BI Server Portal preferences and enable NPS to generate reports in any of the following formats:
- Microsoft Excel 2007
- Microsoft Excel 2007 data
- Microsoft Excel 2002
- Delimited text (CSV) [Comma Separated Value (CSV) Files: displayed as Delimited Text (CSV) on the iSPI Performance BI Server Portal]
- XML
To change the format of the reports generated by NPS:
- Log on to NPS home page with administrator privileges.
- In the navigation panel, click the BI Server tab.
- Click the Portal link.
- In the iSPI Performance BI Portal form, click
 My Area Options.
 - Select My Preferences.
-
In the General tab, select a Report Format. (The default format is HTML.)
- Click OK.
The new report format becomes the default report format for your user account. The BI Portal applies the new report format to all reports generated from your user account.
Set the Same Schedule for Multiple Reports
To set the same schedule for multiple reports, you must create a job. A job identifies a collection of reports, report views, or queries that are scheduled together and share the same settings.
To set the same schedule for multiple reports:
- Log on to the BI Server portal (in the NPS console, click BI Server, and then click Portal).
-
Click the
 New Job icon on
the toolbar.
New Job icon on
the toolbar.The New Job wizard opens.
- Specify a name and location for the job.
-
In the Select the steps–New Job wizard form, click Add to add the job steps.
You can submit the steps in sequence or all at once. To modify the sequence of steps, click Modify the sequence and rearrange the sequence of steps.
- In the Select an action-job form, specify whether you want to save and run, schedule, or only save the new job.
- Click Finish.
Audit
By default, the NNMi tracks a history of the following:
- Sign-in and sign-out activity for each NNMi user.
- Starting and stopping of processes. Examples include starting the BI server, stopping Sybase ASE database.
The NNMi auditing is enabled by default. Audit information is written to a new audit log file every day. The audit log files reside in the following directory:
<OVDataDir>/nmsas/perfspi/log/audit-<yyyy-MM-dd>.log
To see the most recent audit report:
In the NNMi console menu bar, select Tools → NPS Audit Log.
The audit log is available from Tools → NPS Audit Log only if NPS is installed on the NNMi management server.
The log provides a variety of information about the recent account activity.
As an administrator, you can configure the following:
- Disabling Auditing
- Specifying the Retention Period of Audit Logs
Disable Auditing
To disable auditing:
-
Open the following file:
- On Windows:
%ovdatadir%\NNMPerformaceSPI\rconfig\auditlog.prop - On Linux:
/var/opt/OV/NNMPerformaceSPI/rconfig/auditlog.prop
- On Windows:
- Locate the
audit.log.enabledproperty, and then set the property tofalse. - Save your changes.
-
Restart the BI Server by running the following commands:
- stopBI.ovpl
- startBI.ovpl
Specify the Retention Period of Audit Logs
By default, the NNMi retains each archived audit log file, one per day, for 14 days.
To change the retention period of the archived audit log file:
This number does not affect the current day's audit log file.
-
Open the following file with a text editor:
-
On Windows:
%OVDataDir%\NNMPerformanceSPI\rconfig\auditlog.prop - On Linux:
/var/opt/OV/NNMPerformanceSPI/rconfig/auditlog.prop
-
- Locate the
audit.log.maxretentionproperty:audit.log.maxretention=14 - Modify the number to include the number of days the NNMi must retain each audit log file. For example, to change the number of days to one week, enter:
audit.log.maxretention=7 - Save your changes.
-
Restart the BI Server by running the following commands:
- stopBI.ovpl
- startBI.ovpl