Get Started > About the NNMi Console

About the NNMi Console

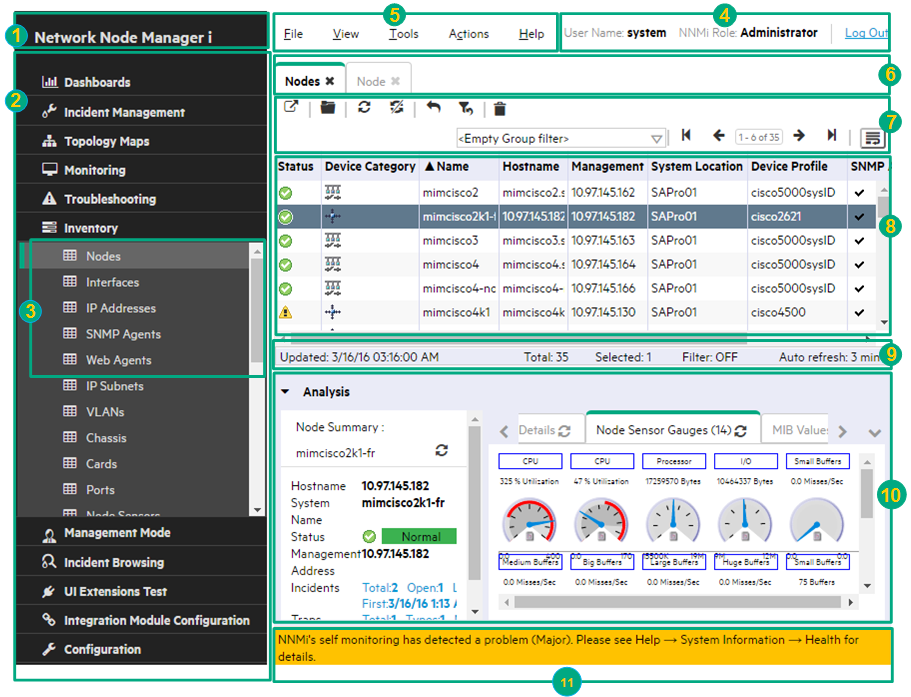
The NNMi console is the graphical user interface for your NNMi application. The main features of the console are shown in the following diagram and explained in the table below.

When using the NNMi console, note the following:

  • If you are using Microsoft Internet Explorer as your browser, you can sign into multiple NNMi sessions on the NNMi server if you use a different user name for each browser session.
  • If you are using Mozilla Firefox as your browser, you can only sign into a single NNMi session on each NNMi server (for example, the Global NNMi server and each Regional NNMi server).
  • You can bookmark the URL for the NNMi console.
  • By default, NNMi displays menus, views, and workspaces that require an additional license. If your NNMi server does not have the required license, NNMi adds the word Unlicensed or Evaluation (caused by the License Type Instant-On or Temporary) to the end of the menu item name or view title.

    The NNMi Administrator can configure the User Interface to hide Unlicensed or Evaluation features.

Network Node Manager Console Features
Section Feature Description
1 Title bar Displays the name of the application you are running. The top-right corner contains the standard browser buttons for closing and resizing the console window.
2 Workspace navigation panel Helps you navigate between different sections of the console.
3 Views

Sections that represent your current scope of interest and work. The workspace panel provides a means of grouping views for a related purpose or task flow. Multiple views are available in each workspace.

4 User, Role, and Sign Out button Your current user name, and role assignment. Your role assignment determines what you can see and do within the NNMi console.
5 Main menu bar

Commands available in the console from within the menu structure:

  • File
  • View
  • Tools
  • Actions
  • Help
6 Tabs

Title of each view and form currently displayed. Each view provides access to a group of objects. More details about each object are available when you double-click the object to display that object's form. The tabs allow you to easily navigate between multiple views and forms.

7 View Toolbar

Tools available within the current view or form. These tools enable you to remove any data filters that you previously applied, restore any columns that you previously hid, and manipulate objects within the view.

The drop-down selectors enable you to modify the factory-set filter values applied to the visible data.

8 Content Pane Displays the currently selected view or form.
9 Status Bar

In the views that provide information in tables, the Status Bar shows the following information:

  • Total. The current number of objects in the database that match the criteria for this table (each row displays data about one object).

    To reduce the number of objects displayed so that you see only the objects of interest, use filters.

  • Selected. Indicates the number of rows selected in the table.
  • Filter. Indicates if the currently displayed data is a filtered subset of available objects.
  • Auto Refresh. Indicates the current refresh time interval.

In map views, the Status Bar shows the following information:

  • The number of nodes displayed on the map.
  • Automatic refresh rate for the Refresh Status option. The Initial Discovery Progress map indicates the refresh rate for Auto full refresh, which refreshes both status and topology.

In both table and map views, the Status Bar displays the Last Updated time to indicate the time at which the view was last refreshed.

10 Analysis Pane

Displays additional information about the network object selected in the view. Examples of additional information include details about an incident's Source Node and Source Object or information about a node's Interfaces and IP Addresses. This pane remains blank until an object is selected.

11 Console message bar Alerts about any problems with NNMi.