


View Maps (Network Connectivity)
NNMi provides several views that display maps of device connections within your network. You can access these views in the Troubleshooting workspace or by using the Actions menu. These views include:
This topic includes the following sections:
- Display the Layer 2 Neighbor View
- Display the Layer 3 Neighbor View
- MPLS WAN Cloud Map (NNMi Advanced)
- Enhanced Path View (NNMi Advanced)
Node Group Maps show the members of a Node Group (defined by the NNMi administrator). The map displays the status and connectivity of each member. Your NNMi administrator can also specify a background image (for example, a map of North America). Child Node Groups display the hierarchy of nodes in a Node Group.
The OSI initiative identified seven layers for communication and computer network protocol design. The Layer 2Refers to the Data Link layer of the multilayered communication model, Open Systems Interconnection (OSI). The Data Link layer moves data across the physical links in the network. The switches and switch-routers are devices that redirect data messages at the layer 2 level, using the destination Media Access Control (MAC) address to determine where to direct the message. and Layer 3Refers to the Network layer of the multilayered communication model, Open Systems Interconnection (OSI). The Network layer is concerned with knowing the address of the neighboring nodes in the network, selecting routes and quality of service, and recognizing and forwarding incoming messages to local host domains. The router and switch-router are the devices that redirect data messages at the Layer 3 level. Everything in a subnet is connected at the Layer 3 (IP) level. Neighbor Views display data according to the Open Systems Interconnection (OSI) model.
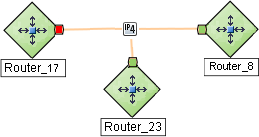
The Path view combines real-time data about both Layer 2 and Layer 3 information.
On the maps, the lines between devices indicate the connections.
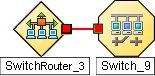
In Layer 2 Neighbor View maps, interfaces that are connected to a neighbor are indicated by little squares around the background shape of the parent node. Pay special attention to the color of the lines, which represent connections. For example:
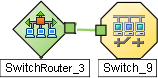
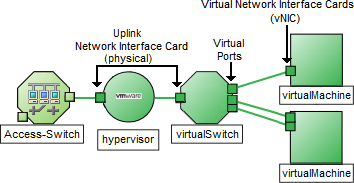
Right-click any hypervisorThe virtual machine manager in charge of delegating various aspects from a pool of resources to become virtual devices. The delegations might be static or dynamic, depending on the manufacture's implementation. The type of virtual machines being generated depends on the manufacturer's implementation. or one of its resources to see the Wheel Dialog or Loom Dialog.
See About Status Colors for more information.
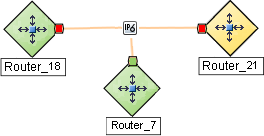
In Layer 3 Neighbor View maps, addresses connected to neighbors within the same IP subnet are indicated by little hexagons around the background shape of the parent node. The lines indicate the subnets, so the lines are beige (no status). For example:
(NNMi Advanced) IPv6 subnets are indicated by this symbol:
The Layer 2Refers to the Data Link layer of the multilayered communication model, Open Systems Interconnection (OSI). The Data Link layer moves data across the physical links in the network. The switches and switch-routers are devices that redirect data messages at the layer 2 level, using the destination Media Access Control (MAC) address to determine where to direct the message. Neighbor View shows a graphical representation of the selected device and any connections with other devices within a specified number of hops from the selected device. Connector devices on Layer 2 are switches and switch-routers. (See About Map Symbols for more information.)
Use this neighbor view when you want to do any of the following tasks:
- Understand the switch connectivity between your devices.
- Find the cause of a connectivity problem (the device status is not Normal).
- Identify the highly-connected nodes in your environment.
- Determine what else might be affected by a problem device, such as an interface.
To display the Layer 2 Neighbor View using the Troubleshooting workspace:
- From the workspace navigation panel, select the Troubleshooting workspace.
- Select Layer 2 Neighbor View.
- In the Node or IP field, type the Name attribute value from the Node Form or any IP Address belonging to a node in your network. (NNMi provides a case-sensitive drop-down list to help speed up your selection.)
A hop is a node representing any network device, such as a workstation, gateway, or switch, which is connected by a link with no intermediate nodes.
Click the Number of Hops drop-down list, and select the number of hops to display (1-9). The default number of hops is 1.
All devices connected to the initial object within the specified number of hops are displayed.
The color of the line between the devices indicates the health of the connection.
A mesh connection represents the location of multiple devices interconnected with each other. A mesh is represented by the following icon:
 (older versions of NNMi used
  )
)
To display the Layer 2 Neighbor View using the Actions menu in a table view or in a form:
From the workspace navigation panel, select the table view of interest.
For example the Inventory workspace, Nodes view.
Select the row representing the object instance of interest (node, interface, or address).
For example, select the row representing the node of interest from the Nodes view.
Select Actions → Layer 2 Neighbor View. The starting node appears with a bold label on a map.
You can also right-click any object in a table or map view to access the items available within the Actions menu.A hop is node representing any network device, such as a workstation, gateway, or switch, which is connected by a link with no intermediate nodes.
Click the Number of Hops drop-down list, and select the number of hops to display (1-9). The default number of hops is 1.
All devices connected to the initial object within the specified number of hops are displayed.
The color of the line between the devices indicates the health of the connection.
A mesh connection represents the location of multiple devices interconnected with each other. A mesh is represented by the following icon:
 (older versions of NNMi used
  )
)
To see more information about a specific connection on the map:
- Select the line or mesh connection icon of interest.
- Click the
 Open icon on the map toolbar.
 - The Layer 2 Connection form displays, showing all information for the connection. See Layer 2 Connection Form for information.
To view the addresses for a particular interface:
Click to select the interface of interest. If the interface is difficult to select, use the + (plus) key to zoom in on the map.
- From the map view toolbar, select the Open icon.
- In the Interface form, select the Addresses tab.
- Each address associated with the interface appears in the IP addresses table.
To view the port number for an interface:
Click the interface of interest.
The port number for the interface appears as a new label.
To view the interface name at each end of a connection:
Click the line representing the connection.
The interface name for each end of the connection appears as a new label. Use Ctrl-Click to select multiple lines and display more interface names.
Troubleshooting Workspace Views: ![]() See Also
See Also
The Layer 3Refers to the Network layer of the multilayered communication model, Open Systems Interconnection (OSI). The Network layer is concerned with knowing the address of the neighboring nodes in the network, selecting routes and quality of service, and recognizing and forwarding incoming messages to local host domains. The router and switch-router are the devices that redirect data messages at the Layer 3 level. Everything in a subnet is connected at the Layer 3 (IP) level. Neighbor View is a graphical representation of the subnets in which the starting node participates, and the health of the routers in those subnets. Connector devices on Layer 3 Neighbor View maps are nodes that have a Device Category value of either router or switch-router. (See About Map Symbols for more information.)
Use this neighbor view when you want to do any of the following tasks:
- Determine whether a subnet is down.
- Understand the router connectivity between your devices.
- Assist in finding the root cause of a connectivity problem (see which device along the communication chain has a status other than normal).
- Identify the highly-connected nodes in your environment.
To display a Layer 3 Neighbor View using the Troubleshooting workpspace:
- From the workspace navigation panel, select the Troubleshooting workspace.
- Select Layer 3 Neighbor View.
In the Node or IP field, type the Name attribute value from the Node Form or any IP Address belonging to a node in your network. (NNMi provides a case-sensitive drop-down list to help speed up your selection.)
You can enter a Node or IP attribute value that represents a node of any Device Category. On the Layer 3 Neighbor View map, NNMi displays only those devices that have a Device Category of router or switch-router that are connected to it.
A hop represents a network device that has a Device Category value of either router or switch-router and that is connected by a link with no intermediate nodes.
Click the Number of Hops drop-down list, and select the number of hops to display (1-9). The default number of hops is 1.
All devices connected to the initial object within the specified number of hops are displayed.
The color of the line between the devices indicates the health of the subnet between the devices.
To display the Layer 3 Neighbor View using the Actions menu in a table view or in a form:
From the workspace navigation panel, select the table view of interest.
For example the Inventory worspace, Nodes view.
Select the initial object of interest.
For example, select the row that represents the node of interest from the Nodes view.
Select Actions → Layer 3 Neighbor View.
You can also right-click any object in a table or map view to access the items available within the Actions menu.A hop represents a network device that has a Device Category value of either router or switch-router and that is connected by a link with no intermediate nodes.
Click the Number of Hops drop-down list, and select the number of hops to display (1-9). The default number of hops is 1.
All devices connected to the initial object within the specified number of hops are displayed.
The color of the line between the devices indicates the health of the connection.
To see more information about a specific subnet on the map:
- Select the line that represents the subnet of interest.
- Click the Open icon on the map toolbar.
The IP Subnet form displays, showing all details of the subnet. SeeIP Subnet Form for more information.
To view address information for an interface at each end of a connection:
Click the line representing the connection of interest.
The IP address for each interface appears as a new label.
Use Ctrl-Click to select multiple lines and display more IP addresses.
Troubleshooting Workspace Views: ![]() See Also
See Also
MPLS WAN Cloud Map (NNMi Advanced)
(NNMi Advanced, plus Route Analytics Management System (RAMS) for MPLS WAN) The MPLS WAN Cloud Map view displays a graphical representation the Layer 3 connectivity in your network, as well as any Customer Edge and Provider Edge devices. This map periodically updates the Customer Edge (CE) status. The MPLS WAN discovery updates the topology. The update interval is more frequent when the topology is changing and less frequent when the topology is not changing.
To discover MPLS WANs in the Network:
After installing and configuring the RAMS Integration Module, NNMi startup discovers all the MPLS WANs in the network.
- From the workspace navigation panel, select the Inventory workspace.
- Select the MPLS WAN Clouds (RAMS).
- From the Actions menu, select Discover MPLS WANs. This discovers all the MPLS WANs in the network.
To display the MPLS WAN Cloud Map view:
- In the MPLS WAN Cloud table view, select a row.
- From the Actions menu, select MPLS WAN Cloud View.
This displays the selected object's Cloud view.
Use this view when you want to do any of the following tasks:
- View a high-level overview of your MPLS WAN Cloud
- Determine the most highly connected nodes in the Layer 3 network
The symbols used in MPLS WAN Cloud view are described in the following table:
| Symbol | Description |
|---|---|
 | The MPLS WAN Cloud. The icon indicates that the status of the devices in the cloud is unknown. |
 | The IP address of the Provider Edge (PE) device. Status of a PE is indicated by the color. For example, blue color indicates that the status of the device is unknown. For more information, see Status Color and Meaning for Objects. |
 | The CE router that is participating in the MPLS WAN cloud. |
 | The Interface on the CE router that is peering with the PE device. The color of the icon shows the status of the CE router. For more information, see Status Color and Meaning for Objects. |
Select the connector between PE device and CE router to view the IP addresses of the PE device and the Interface name of CE router.
NNMi Advanced uses any of the following when calculating a Path View:
Router Redundancy Protocol group members (for example, HSRPHot Standby Router Protocol or VRRPVirtual Router Redundancy Protocol)
By default, NNMi monitors current state and priority information for any discovered Router Redundancy Group objects in the network. If the configured Router Redundancy Protocol allows virtual addresses, NNMi includes those virtual addresses when calculating the Path View.
(Route Analytics Management System (RAMS) for MPLS WAN) Router Analytics Management System (RAMSHPE Router Analytics Management System) data
If your NNMi Administrator established any RAMS server configurations, NNMi Advanced calculates the Path View using RAMS data. (RAMS is an IP Route Analytics tool that listens to routing protocols and builds a real-time routing topology map.) If you are an NNMi administrator, see RAMS MPLS WAN Configuration (NNMi Advanced) for more information.
When using RAMS data in Path View, NNMi ignores the
PathConnections.xmlfile. See "Help for Administrators" for more information.RAMS enhances NNMi's ability to trace the route path between the source and destination node in the following ways:
- NNMi Advanced does not use SNMP to calculate the router path. This means that NNMi Advanced does not need to wait for SNMP responses and can calculate the Path View more quickly.
- NNMi Advanced displays equal cost paths when calculating the router path. More than one path appears if Router Analytics Management System (RAMS) determines more than one equal cost path and, therefore, cannot determine which path is in use.
(NNMi Advanced) Path View works only with IPv4 addresses. The NNMi Advanced IPv6 address values are not valid choices for Path View. Any devices in your network that are configured with IPv6 addresses cannot be displayed in Path View maps.
Troubleshooting Workspace Views: ![]() See Also
See Also
Related Topics: