


Learn Your Network Inventory
After NNMi discovers your network (or rediscovers it on a regular basis), you have several options for exploring up-to-date information about what was discovered.
Within any table view, you can quickly view a few additional properties of your network devices. To do so, click the row representing a network object. NNMi provides Analysis Pane information at a glance for object attributes.
Forms are a way to gain a more in depth understanding of a particular object instance. To view the form for the object's attributes, from a table view, double-click the row that contains the object information. The form containing the information for the object's attributes appears.
You can also access another form from the current one for any related objects. Related objects in a form appear as lookup fields. Each  Lookup field includes a drop-down list that lets you open the form for that object.
You can filter views using pre-defined Node Groups and Interface Groups . Select a filter by using the  drop-down filter selection. See Filter Views by Node or Interface Group for more information about filters.
In the form for that object, you can view or edit the information for the selected object as described in Working with Objects.
NNMi supports physical and virtual network objects. See About Network Objects for more information.
For a short description of each Inventory view: Views Available in NNMi
This topic includes the following sections:
- About Network Objects
- Filter Views by Node or Interface Group
- Nodes View (Inventory)
- Interfaces View (Inventory)
- IP Addresses View (Inventory)
- SNMP Agents View
- Web Agents View
- IP Subnets View (Inventory)
- VLANs View (Inventory)
- Light Weight AP View
- Chassis View
- Cards View
- Radio Cards View
- Ports View
- Node Sensors View
- Physical Sensors View
- Layer 2 Connections View (Inventory)
- Nodes by Management Server View (Inventory)
- Nodes (All Attributes) View (Inventory)
- Interfaces (All Attributes) View (Inventory)
- IP Addresses (All Attributes) View (Inventory)
- MIB Variables View (Inventory)
- Chassis Redundancy Groups View (Inventory)
- Card Redundancy Groups View (Inventory)
- Router Redundancy Group View
- Router Redundancy Members View (Inventory) (NNMi Advanced)
- Node Groups View (Inventory)
- Interface Groups View (Inventory)
- Performance Analysis with Additional Views
- MPLS WAN Clouds (RAMS) View (NNMi Advanced)
Inventory Workspace Views: ![]() See Also
See Also
About Network Objects
NNMi can monitor and analyze a variety of network devices and components within those devices. NNMi uses the SNMP protocol and the ping network administration utility to retrieve up-to-the-minute information. NNMi supports both physical and virtual (logical) devices.
The following list shows the specific network objects that NNMi monitors and analyzes. Click an object for more information.
The following objects represent physical components:
- Cards
- Chassis
- Physical Sensors (backplane, fan, power supply, temperature gauge, and voltage regulator)
- Ports
The remaining items in the following list can be physical or virtual.
-
Aggregator Interfaces (NNMi Advanced)
An Aggregator Interfaces is a set of interfaces on a switch that are linked together, usually for the purpose of creating a trunk (high bandwidth) connection to another device. Aggregator Interfaces have designated Aggregation Member Interfaces.
-
Aggregator Layer 2 Connection (NNMi Advanced)
An Aggregator Layer 2 Connection is a connection with endpoints that are Aggregator Interfaces. These are usually high-bandwidth connections that link switches. Aggregator Layer 2 Connections have Aggregator Interfaces and Aggregation Members. -
Cards
A card is a physical component on a device which generally has physical ports that contain one or more interfaces used to connect to other devices. A card can also contain sub-cards. The card containing another card is known in NNMi as the Parent Card. The sub-card is known as a Daughter Card. NNMi supports Daughter cards one level deep.
-
Card Redundancy Groups
A Card Redundancy Group is a set of card modules that are configured to provide card redundancy on the device. These cards are management modules on Cisco and s Procurve platforms. The number of cards supported in a group on both platforms is two. The Card Redundancy Group has one card acting as the primary member, the other acting as the secondary. If the primary card fails, the secondary card takes over as the primary card.
-
Chassis
A Chassis is a physical component on a device into which other objects are plugged, such as cards. A Chassis can also contain sub-chassis. The Chassis containing another Chassis is known in NNMi as the Parent Chassis. The sub-chassis is known as the Child Chassis. A Child Chassis can be one-level deep.
NNMi supports the following scenarios:
- A single node running on one chassis
- Multiple nodes running on one chassis
- A single node running on multiple chassis
Chassis are connected by Inter Switch Links (ISL). A port used for the Inter Switch Link is designated with the Type IRF physical port and is associated with the card or chassis on which it resides.
-
Chassis Redundancy Groups
A Chassis Redundancy Group is a set of chassis that are configured to provide redundancy (for example, for switches). Each redundancy group member is discovered as a Chassis managed by a node. Each Chassis Redundancy Group member has one of the following roles:
- Master - Indicates the chassis is the master member of the Chassis Redundancy Group.
- Slave - Indicates the chassis is a slave member of the Chassis Redundancy Group.
-
Field Replaceable Units (FRU Card)
A Field-Replaceable-Unit (FRU) card is a card that can be replaced on a device that is operationally active (not powered down). When an FRU card is removed from or added to the device, NNMi reports the occurrence with an incident. If an FRU card is not recognized by the device, NNMi reports the unrecognized card with an incident.
-
Interfaces
An interface is a logical object that might or might not be associated with a physical port. Interfaces are used to identify connections between nodes. Multiple interfaces can be associated with a single physical port. NNMi identifies interfaces using either of the following values:
- ifName
- ifAlias
- ifType[ifIndex] (for example, ethernetCsmacd[17])
Each physical port managed by NNMi is associated with one or more interfaces. NNMi identifies ports using the <Card-number / Port-number> value.
-
Interface Groups
An Interface Group is a logical collection of interfaces created by an NNMi administrator.
-
IP Addresses
An IP address is a routable address that responds to ICMP. IP addresses are typically associated with nodes.
-
IP Subnets
Identifies all of the networks within your management domain. Each IP Subnet represents an IP Subnet within a particular Tenant (that IPv4 Subnet definition independently applies to each Tenant).
-
Layer 2 Connections
Connections are Layer 2 physical connections and Layer 3 network connections. NNMi discovers connection information by reading forwarding database (FDB) tables from network devices and gathering data from a variety of Layer 2 discovery protocols (see the list of Topology Source protocols in Layer 2 Connection Form).
-
Nodes
A node is a device that NNMi finds as a result of the Spiral Discovery process. A node can contain interfaces, boards, and ports. You can separate nodes into two categories:
-
Network nodes, which are active devices such as switches, routers, bridges, and hubs
These nodes can be physical or virtual and can represent one or more additional objects, such as a switch stack.
- End nodes, such as Linux or Windows servers
-
-
Node Sensors
Some network devices enable SNMP Agents to monitor certain aspects of ongoing usage such as buffers, CPU utilization, disk utilization, and memory utilization. NNMi administrators can monitor the health of these by configuring node sensors to alert their team members when any of these aspects of operation are marginal or failing.
-
Node Groups
A Node Group is a logical collection of nodes created by an NNMi administrator.
-
Physical Sensors
Some network devices enable SNMP Agents to monitor internal components such as backplane, fan, power supply, temperature guage, and voltage regulator. NNMi administrators can monitor the health of these components by configuring physical sensors to alert their team members when any of these components operate marginally or fail.
-
Ports
Physical ports hosted on a card, used by a node that NNMi is monitoring.
-
Router Redundancy Groups (NNMi Advanced)
A Router Redundancy Group is a set of routers that are configured to provide redundancy in the network. Such groups use the following two types of protocols:
- Hot standby router protocol (HSRP)
- Virtual router redundancy protocol (VRRP)
Router Redundancy Groups usually have a single device acting as the primary, a single device acting as a secondary, and any number of standby devices. If the primary device fails, the secondary device should take over as primary, and one of the standby devices should become secondary. The router groups employ either the HSRP or VRRP protocol to designate the primary, secondary, and standby routers.
-
Router Redundancy Members (NNMi Advanced)
Each router in the Router Redundancy Group.
-
SNMP Agents
An SNMP agent is a process interacting with the managed node and providing management functions. The SNMP agent is responsible for SNMP communications with the managed node. An SNMP Agent can be associated with one or more nodes.
-
VLANS
A virtual local area network (VLAN) is a logical network within a physical network. The VLAN creates a reduced broadcast domain. Participating devices can physically reside in different segments of a LAN. After the VLAN is established, the participating devices behave "as if" they were all connected to one LAN. For example, switches within the same layer 2 switching fabric (switches that hear one another and do not have layer 3 routers between them) can be in a VLAN (identified by the VLAN Identifier value, the VLAN Id).
Several VLANs can co-exist within a network. Devices can participate in multiple VLANs. And trunk ports can participate in multiple VLANs.
There are several types of VLANs. NNMi supports switch port VLANs.
Filter Views by Node or Interface Group
When monitoring your network, you might be interested in only viewing information for a particular set of nodes or interfaces. Your network administrator can group sets of nodes or interfaces into node or interface groups. An example of a Node Group could be all important Cisco routers, or all routers in a particular building. As another example, all interfaces used for Voice-Over-IP might be grouped together in an Interface Group.
Node Group filters are available for:
- Node views
- Interface views
- IP address views
- Incident views
- Node Sensor views
- Physical Sensor views
Interface Group filters are available for:
- Interface views
- IP Address views
- Card views
To filter a view by Node or Interface Group:
-
Navigate to the view of interest.
- From the workspace navigation panel, select the workspace that contains the view you want to use; for example, Inventory.
- Select the view of interest; for example, Interfaces.
- In the group selector drop-down list, select the Node Group or Interface Group you want to use as a filter.
When using Node Group or Interface Group filters, note the following:
- By default, table views are not filtered by Node or Interface Group.
- If a view can be filtered by both Node Group and Interface Group, the selection box lists the Node Groups first, followed by the Interface Groups. Each list appears in alphabetical order.
- When the filter is applied, the view automatically refreshes to show the appropriate set of objects.
- If you set a Node Group or Interface Group filter, NNMi combines the group filter with any other filters using the AND Boolean operator.
- To clear the group filter, return the selection value to "<Set node group filter>" or "<Set node or interface group filter>".
See Node Form for more details about the node attributes that appear in this view's column headings.
The Nodes view is useful for identifying all of the nodes being managed by NNMi.
For each node displayed, you can identify its overall status (for example, Normal, Warning, Minor, Major, Critical, or Unknown), device category (for example, Switch), name, hostname, management address, system location (the current value of the sysLocation MIB variable), device profile, whether the SNMP agent is enabled or not, date indicating the last time the node status was modified, which NNMi management server is responsible for this node, and any notes included for the node.
To display the Nodes view:
- In the Workspaces navigation pane, select the Inventory workspace.
- Select the Nodes view.
Node views are useful for quickly identifying items described in the following table.
| Use | Description |
|---|---|
|
View all problem nodes |
Sort the view by Status so that you can be quickly alerted to existing and potential problems. |
|
View all device types being managed |
Sort the view by the Device Profile attribute. |
|
Identify whether the problem can be isolated to a particular area of your network |
Sort the view by System Location. This is the current value of the sysLocation MIB variable. |
|
View address and subnet information associated with a selected node to better determine the scope of the problem |
From the Nodes view, open the Node form. Select the Addresses tab. |
|
Access a map view of a selected node and its surrounding topology |
Select the node of interest and use the Actions menu from the main toolbar to select either the Layer 2 or Layer 3 Neighbor View. |
|
View the statuses of interfaces in the node |
If a node is not completely down, you might want to see which interfaces are down for the selected node. To do so, open the Node form and select the Interfaces tab. |
|
The number of devices that are served by this node. |
Select the node you want and access the Layer 2 or Layer 3 Neighbor View using the Actions menu. |
| View the status of all of the nodes that have been grouped together in a nodes group; for example, all of your important Cisco routers. | Your NNMi administrator can create Node Groups. These groups might contain only the nodes important to you. See Filter Information in a Table View for more information. |
| (NNMi Advanced - Global Network Management feature) If your NNMi management server is a Global Manager, identify which nodes are managed by each Regional Manager. |
See NNMi's Global Network Management Feature (NNMi Advanced) for more information. Sort the Node view using the NNMi Management Server column (at the far right of the view). Local = The NNMi management server you are currently signed into. <name> = The name your NNMi administrator assigned to a Regional Manager (NNMi management server). If you see a <name> value, it means that you are currently signed into a Global Manager, and other NNMi management servers report to this NNMi management server. |
Inventory Workspace Views: ![]() See Also
See Also
See Interface Form for more details about the interface attributes that appear in this view's column headings.
The Interfaces view in the Inventory workspace is useful for identifying the network interfaces managed by NNMi.
For each interface displayed in the view, you can identify the interface’s overall status (for example, Normal, Warning, Minor, Major, Critical, or Unknown), its administrative (AS) and operational (OS) status, associated node Name value (Hosted On Node), the interface name, interface type, interface speed, input speed, output speed, the date the interface information was last changed, its description, the ifAlias value, the date and time its status was last changed, the date and time its state was last changed, and any notes included for the interface.
To display the Interfaces view:
- In the Workspaces navigation pane, select the Inventory workspace.
-
Select the Interfaces view.
If you see several blank columns for an interface in a table view, note the following:
-
The interface might be in a non-SNMP node.
For interfaces on non-SNMP nodes, note the following:
- The interface index (
ifIndex) value is always set to 0 (zero). - The interface type (
ifType) is set to Other. -
The interface Name (
ifName), if none is available, is set to Pseudo Interface.For Pseudo Interface, NNMi attempts to obtain additional information using a variety of discovery protocols (see the list of Topology Source protocols in Layer 2 Connection Form).
- If the interface hosts an IP address, the interface Alias (
ifAlias) is set to the IP address. Otherwise, the interface Alias (ifAlias) is set with information from neighboring SNMP devices. - NNMi obtains the MAC address if the IP address can be resolved using ARP cache.
- The interface index (
-
The interface might be a Nortel private interface.
For Nortel SNMP interfaces, note the following:
- The interface index (
ifIndex) value is set according the Nortel private MIB. - NNMi tries to collect the MAC address and interface name using Nortel's private MIBs.
- The interface index (
-
(NNMi Advanced) The interface might be an IPv-6 interface.
A small number of IPv6 devices do not support the standard RFC 2863 IF-MIB for IPv6 interfaces. In this case, NNMi uses the RFC 2465 IPv6-MIB. When this happens, note the following:
- Interface index (
ifIndex) and description (ifDescr) are set according to the RFC 2465 IPv6 MIB. - Interface type (
ifType) is set toOther(no specific type is available). - Interface Name (
ifName), Alias (ifAlias), and Speed (ifSpeed) are blank (not available). - NNMi monitors the Status of this interface, but Performance metrics are not available.
When an IP Address has the Interface Name (
ifName) attribute set to blank, NNMi constructs an alternate string for the IP Address's In Interface attribute (Other[<ifIndex_value>]). - Interface index (
-
Interface views are useful for quickly identifying items described in the following table.
| Use | Description |
|---|---|
|
View all network interfaces per node |
Sort the view by Hosted On Node. This is the current value in NNMi’s database for the Name attribute of the host device. |
|
Determine the health of each of the managed interfaces |
Sort the view by the Status attribute. |
|
Access a map view of the network interface and its surrounding topology. |
Select the interface of interest and use the Actions menu to select either the Layer 2 or Layer 3 Neighbor view. See Using Table Views for more information. |
| View the status of all of the interfaces that have been grouped together in a node or an interfaces group; for example, all of the interfaces on the important Cisco routers or all of the Voice-Over-IP interfaces within your network. | Your NNMi administrator can create nodes and interface groups. These groups might include only those nodes or interfaces important to you. Now you can filter the interfaces view by a node or an interface group. See Filter Views by Node or Interface Group for more information. |
Inventory Workspace Views: ![]() See Also
See Also
See IP Address Form for more information about the IP address attributes that appear in this view's column headings.
The IP Addresses view in the Inventory workspace is useful for identifying all of the IP addresses being managed by NNMi.
For each IP address displayed, you can identify its status, state, IP address, interface name (In Interface), associated node Name value (Hosted On Node), the subnet prefix (In Subnet) and prefix length (PL), the date and time its status was last changed, and any notes included for the IP address.
To display the IP Addresses view:
- In the Workspaces navigation pane, select the Inventory workspace.
- Select the IP Addresses view.
The IP Address view is useful for quickly identifying items described in the following table.
| Use | Description |
|---|---|
| View all IP addresses per node | Sort the view on Hosted On Node attribute. |
| View the addresses per interface | Sort the view on the Interface name (In Interface) attribute. |
| View the addresses per subnet | Sort the view on the subnet (In Subnet) attribute. |
| View the subnet information for a selected IP address |
To access a subnet from this view:
|
| View the status of all of the addresses for the nodes that have been grouped together in a nodes group; for example, all of your important Cisco routers. | Your NNMi administrator can create node or interface groups. These groups might include only those nodes or interfaces important to you. Now you can filter the addresses view by a node or interface group. See Filter Views by Node or Interface Group for more information. |
 Open to access the IP Subnet form.
Inventory Workspace Views: ![]() See Also
See Also
See SNMP Agent Form for more details about the SNMP Agent attributes that appear in this view's column headings.
The Non-Normal SNMP Agents view in the Monitoring workspace is useful for identifying all of the SNMP Agents that have a state that is other than Normal.
To display the Non-Normal Node SNMP Agents view:
- In the Workspaces navigation pane, select the Monitoring workspace.
- Select the Non-Normal SNMP Agents view.
For each SNMP Agent displayed in the view, you can identify the SNMP Agent Status, the Agent SNMP State, the Agent ICMP State, the Management Address ICMP Response Time, the Management Address ICMP Response Time Baseline, the associated node Name value (Hosted On Node), the IP address NNMi uses to communicate with this SNMP agent (Management Address), the date and time the Status was last modified, the version of the SNMP protocol in use, whether the SNMP agent is set up for SNMP communication in the network environment (SNMP Agent Enabled), the User Datagram Protocol port configuration for this SNMP agent (UDP Port), the time that NNMi waits for a response to an SNMP query before reissuing the request, and the maximum number of retries that NNMi issues for an SNMP query before determining the query result to be "unresponsive", the SNMP Proxy address, and the SNMP Proxy port.
If you have Administrator Role, the SNMP Agents view also displays the Read Community String.
Inventory Workspace Views: ![]() See Also
See Also
See Web Agent Form (NNMi Advanced) for more details about the Web Agent attributes that appear in this view's column headings.
For each Web AgentThe Web Agent represents a management service running on a device and contains the settings NNMi uses to communicate with the device. displayed in the view, you can view the following details:
- Status of the Web Agent
- Agent State
- Hosted on Node (device on which the Web Agent resides)
- Hostname (FQDN) of the host device
- Mode
- Agent Enabled
- Scheme (communication)
- Port (on which the Web Agent listens)
- Timeout
- Status Last Modified
- Last Modified
- Last Modified By
See IP Subnet Form for more details about the IP subnet attributes that appear in this view's column headings.
The IP Subnets view in the Inventory workspace is useful for identifying all of the networks within your management domain.
For each IP subnet displayed, you can identify its name, prefix, prefix length (PL), and any notes included for the subnet.
To display the IP Subnets view:
- In the Workspaces navigation pane, select the Inventory workspace.
- Select the IP Subnets view.
The IP Subnets view is useful for quickly identifying items described in the following table.
| Use | Description |
|---|---|
|
Determine all nodes within a subnet |
Use the Layer 3 Neighbor view to easily see the number of problem nodes within a subnet. |
|
Browse for large and small subnets |
Scan the Name column to view the list of available subnets. |
You can identify empty subnets by opening the form for a selected subnet and viewing the IP addresses table.
Inventory Workspace Views: ![]() See Also
See Also
A virtual local area network (VLAN) is a logical network within a physical network. The VLAN creates a reduced broadcast domain. Participating devices can physically reside in different segments of a LAN. After the VLAN is established, the participating devices behave "as if" they were all connected to one LAN. For example, switches within the same layer 2 switching fabric (switches that hear one another and do not have layer 3 routers between them) can be in a VLAN (identified by the VLAN Identifier value, the VLAN Id).
Several VLANs can co-exist within a network. Devices can participate in multiple VLANs. And trunk ports can participate in multiple VLANs.
There are several types of VLANs. NNMi supports switch port VLANs.
NNMi does not currently support protocol-based VLANs and MAC-based VLANs.
VLANs that reside in separate broadcast domains can have identical names. And one VLAN can have multiple names. For example, two switches participate in the same VLAN (VLAN Id=10), but the VLAN name is different on each switch. Those switches are nonetheless still participating in the same VLAN.
To sort the VLANs view and group all devices in a particular VLAN together, click the VLAN Id column heading.
To display the VLAN view:
- In the Workspaces navigation pane, select the Inventory workspace.
-
Select the VLANs view.
NNMi ignores VLAN-1 because that is the default VLAN Identifier, but NNMi discovers any higher numbered VLANs.
-
Use the VLAN view to quickly identify all of the switch port VLANs configured in your network environment:
The table displays a row for each VLAN member and columns for the following:
-
Global VLAN Name
VLAN connections are determined by a common VLAN Id. The name assigned to that VLAN can be designated by each participating Node's configuration settings for that VLAN Id. Therefore, NNMi chooses a VLAN name for this value (from potentially many names for the same VLAN ID). NNMi uses the lowest sort-order name from all available names designated by member Nodes.
- VLAN Id (identifier value)
- Member Node Count
- Member Node[Interface] (
hostname[Interface Name])
If your VLAN view contains two or more VLANs with the same name, those VLANs exist in separate broadcast domains.
-
-
Use the VLAN Members Map in the Analysis pane to see a map view of the members of the VLAN. The VLAN Members Map shows the members of a VLAN in a Layer 2 map.
To launch the VLAN Members Map in a separate view, right-click a view in the VLANs view, and then click Maps > VLAN Members View.
Inventory Workspace Views: ![]() See Also
See Also
Light Weight AP View
The Light Weight AP view in the Inventory workspace is useful for identifying all of the wireless access points available on the routers that are discovered by NNMi. To view the access point per router node, use the Managed By column to sort the view.
To view the Access Point view:
- In the Workspaces navigation pane, select the Inventory workspace.
- Select the Light Weight AP view.
For each access point displayed in this view, you can view the following details:
- Status
- Administrative state
- Operational state
- Name of the associated node (Managed By)
- The date and time the status was last modified
- Access point name
- Model type (the hardware manufacturer's designator)
- Serial number
- Firmware version
- Hardware version
- Software version
- Component identifier number
- The time the state was last modified.
See Chassis Form for more details about the Chassis attributes that appear in this view's column headings.
The Chassis view in the Inventory workspace is useful for identifying all of the Chassis hosted on the nodes that are stored in the NNMi database. To view the Chassis per node, use the Managed By column to sort the view.
See Use Table Views for more information about sorting, filtering, and hiding attribute columns within a view.
To display the Chassis view:
- In the Workspaces navigation pane, select the Inventory workspace.
- Select the Chassis view.
For each Chassis displayed in this view, you can identify the Chassis Status, Administrative State, Operational State, name of the associated node (Managed By), the date and time the Status was last modified, the Chassis Name, model type (the hardware manufacturer's designator), Serial Number, Firmware Version, Hardware version, Software Version, Component Identifier number, time the state was last modified, Parent Chassis (name of the chassis, if any, to which the selected child chassis is attached), Redundant Group, if any, in which the chassis participates, and Description.
To see the incidents related to a Chassis:
- Double-click the row representing a Chassis. The Chassis Form displays all details about the selected Chassis.
- Navigate to the Incidents tab to see the incidents associated with the selected Chassis.
Inventory Workspace Views: ![]() See Also
See Also
See Card Form for more details about the Card attributes that appear in this view's column headings.
The Card view in the Inventory workspace is useful for identifying all of the Cards associated with the nodes that are stored in the NNMi database. To view the Cards per node, use the Managed By column to sort the view.
See Use Table Views for more information about sorting, filtering, and hiding attribute columns within a view.
To display the Cards view:
- In the Workspaces navigation pane, select the Inventory workspace.
- Select the Cards view.
For each Card displayed in this view, you can identify the Card Status, Administrative State, Operational State, Name of the associated node (Managed By), the date and time the Status was last modified, the Card Name, model, Type (the hardware manufacturer's designator), Serial Number, Firmware Version, Hardware Version, Software Version, Component Identifier number, Physical Index number, Parent Card (name of the card, if any, in which the selected child card is attached), Redundant Group, if any, in which the card participates, the date and time the State was last modified, and a Description, and any Notes for the Card.
To see the incidents related to a Card:
- Double-click the row representing a Card. The Card Form displays all details about the selected Card.
- Navigate to the Incidents tab to see the incidents associated with the selected Card.
Inventory Workspace Views: ![]() See Also
See Also
Radio Cards View
The Radio Cards view in the Inventory workspace is useful for identifying all of the radio cards available on the lightweight access points that are discovered by NNMi. To view the radio card per access point, use the Managed By column to sort the view.
To view the Access Point view:
- In the Workspaces navigation pane, select the Inventory workspace.
- Select the Radio Cards view.
For each access point displayed in this view, you can view the following details:
- Status
- Administrative state
- Operational state
- Name of the associated node (Managed By)
- The date and time the status was last modified
- Card name
- Model type (the hardware manufacturer's designator)
- Serial number
- Firmware version
- Hardware version
- Software version
- Component identifier number
- The time the state was last modified.
See Port Form for more details about the Port attributes that appear in this view's column headings.
The Ports view is useful for identifying all of the Ports hosted on the nodes that are stored in the NNMi database. To view the Ports per node, sort the Ports view by the Hosted On Node attribute.
See Use Table Views for more information about sorting, filtering, and hiding attribute columns within a view.
To display the Ports view:
- In the Workspaces navigation pane, select the Inventory workspace.
- Select the Ports view.
For each Port displayed in this view, you can identify the name of the Node in which the Card resides (Hosted On Node), the Port Name, Type (hardware-type designator), Speed, Configured Duplex Setting, if any, the Card on which the Port resides, the interface to which the Port is associated, and any ifAlias.
Inventory Workspace Views: ![]() See Also
See Also
See Node Sensor Form for more details about the node sensor attributes that appear in this view's column headings. Node Sensors are displayed in three views: Node Sensors View, Non-Normal Node Sensors View, and Unmanaged Node Sensors View.
The Unmanaged Node Sensor view in the Management Mode workspace is useful for identifying all of the Node Sensors that are not currently being used.
To display the Node Sensors view:
- In the Workspaces navigation pane, select the Inventory workspace.
- Select the Node Sensors view.
For each Node Sensor displayed in the view, you can identify the Status, Name, Type, Hosted On Node, and Status Last Modified time.
Inventory Workspace Views: ![]() See Also
See Also
See Physical Sensor Form for more details about the node sensor attributes that appear in this view's column headings. Node Sensors are displayed in three views: Physical Sensors View, Non-Normal Physical Sensors View, and Unmanaged Physical Sensors View.
To display the Physical Sensors view:
- In the Workspaces navigation pane, select the Inventory workspace.
- Select the Physical Sensors view.
For each Physical Sensor displayed in the view, you can identify the Status, Name, Type, Managed By, Hosted On, and Status Last Modified time.
The NNMi administrator can set Physical Sensor thresholds. For more information, see Chassis Form: Physical Sensors Tab and Card Form: Physical Sensors Tab.
Inventory Workspace Views: ![]() See Also
See Also
See Layer 2 Connection Form for more details about the Layer 2 Connection attributes that appear in this view's column headings.
The Layer 2 Connections view in the Inventory workspace is useful for identifying all of the connections being managed by NNMi. Sorting this view by Topology Source lets you easily identify all user added connections.
For each connection displayed in the view, you can identify the status, name, the data source or protocol (Topology Source) used to create the connection (for example CDP or USER), the date and time the connection was last modified, and any notes related to the connection.
To display the Layer 2 Connections view:
- In the Workspaces navigation pane, select the Inventory workspace.
- Select the Layer 2 Connections view.
Inventory Workspace Views: ![]() See Also
See Also
See Node Form for more details about the node attributes that appear in this view's column headings.
(NNMi Advanced) The Global Network Management feature enables multiple NNMi management servers to share the workload in your network environment. See NNMi's Global Network Management Feature (NNMi Advanced) for more information about this feature.
If the Global Network Management feature is enabled in your environment, and your NNMi management server is a Global Manager, the Nodes by Management Server view provides a filter to show which nodes each NNMi management server is responsible for discovering and monitoring:
Local = The NNMi management server you are currently signed into.
<name> = The name your NNMi administrator assigned to a Regional Manager (NNMi management server). If you see a <name> value, it means that you are currently signed into a Global Manager, and other NNMi management servers report to this NNMi management server.
By default, NNMi uses the first value in the Quick Filter list. If your view is empty, change the filter value. Here is an example of a Quick Filter list: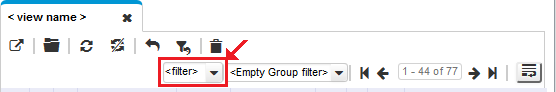
If you filter your view using additional filters, such as Node Groups, NNMi uses the AND operator to combine the filters you have selected. See Filter a Table View for more information.
To display the Nodes by Management Server view:
- In the Workspaces navigation pane, select the Inventory workspace.
- Select the Nodes by Management Server view.
- Click the filter drop-down and choose the name of the NNMi management server that has the list of Nodes you want to view.
For each node displayed, you can identify its overall status (for example, Normal, Warning, Minor, Major, Critical, or Unknown), device category, name, hostname, management address, system location (the current value of the sysLocation MIB variable), device profile, date indicating the last time the node status was modified, and any notes included for the node.
Inventory Workspace Views: ![]() See Also
See Also
See Node Form for more details about the node attributes that appear in this view's column headings.
The Nodes (All Attributes) view enables you to create a customized view of nodes. This view includes most of the attributes available for the node so that you can decide which are most important for you to display. See Use Table Views for more information about sorting, filtering, and hiding attributes within a view.
To display the Nodes (All Attributes) view:
- In the Workspaces navigation pane, select the Inventory workspace.
- Select the Nodes (All Attributes) view.
The Nodes (All Attributes) view includes the node's overall status (for example, Normal, Warning, Minor, Major, Critical, or Unknown), device category (DC), name, fully-qualified hostname (including the domain name, if available), management address, system location (the current value of the sysLocation MIB variable), device profile, whether the SNNP agent is enabled, the date indicating the last time the node status was modified, any notes that exist for the node, its system name, (if this is a virtual machineA device that utilizes components from multiple physical devices. Depending on the manufacture's implementation, the virtual machine may be static or dynamic.) the name of the server this node is hosted on, system contact name, a system description, which NNMi management server is responsible for this node, the Node Management Mode, the system object ID (MIB-II sysObjectID), the device vendor, the device family, the name of its SNMP agent, the SNMP protocol version, the Agent SNMP state, the Agent ICMP state, the date the node's state was last modified, the Tenant and Security Group assigned to the node, its discovery state, the date and time the discovery last completed, the creation date, and the date and time the node was last modified.
See Nodes View (Inventory) for more information about ways to use a node view.
Inventory Workspace Views: ![]() See Also
See Also
See Interface Form for more details about the interface attributes that appear in this view's column headings.
The Interfaces (All Attributes) view in the Inventory workspace lets you choose the columns of interface information, to better meet your needs. For example, you might want to filter the view to display only the interfaces related to a particular set of devices.
This view includes most of the attributes available for the incident so that you can decide which are most important for you to display. See Use Table Views for more information about sorting, filtering, and hiding attributes within a view.
For each interface displayed, you can view its status, its administrative state and operational state, the associated hostname (Hosted On Node), its interface name, type, speed, description, the value of its alias, the date and time the status was last modified, the date and time the state was last modified, the name of the Layer 2 Connection associated with the interface, any notes related to the interface, its direct management mode, its node management mode, the physical address, the interface index, the creation date, and the date and time the interface was last modified.
To display the Interfaces (All Attributes) view:
- In the Workspaces navigation pane, select the Inventory workspace.
-
Select the Interfaces (All Attributes) view.
If you see several blank columns for an interface in a table view, note the following:
-
The interface might be in a non-SNMP node.
For interfaces on non-SNMP nodes, note the following:
- The interface index (
ifIndex) value is always set to 0 (zero). - The interface type (
ifType) is set to Other. -
The interface Name (
ifName), if none is available, is set to Pseudo Interface.For Pseudo Interface, NNMi attempts to obtain additional information using a variety of discovery protocols (see the list of Topology Source protocols in Layer 2 Connection Form).
- If the interface hosts an IP address, the interface Alias (
ifAlias) is set to the IP address. Otherwise, the interface Alias (ifAlias) is set with information from neighboring SNMP devices. - NNMi obtains the MAC address if the IP address can be resolved using ARP cache.
- The interface index (
-
The interface might be a Nortel private interface.
For Nortel SNMP interfaces, note the following:
- The interface index (
ifIndex) value is set according the Nortel private MIB. - NNMi tries to collect the MAC address and interface name using Nortel's private MIBs.
- The interface index (
-
(NNMi Advanced) The interface might be an IPv-6 interface.
A small number of IPv6 devices do not support the standard RFC 2863 IF-MIB for IPv6 interfaces. In this case, NNMi uses the RFC 2465 IPv6-MIB. When this happens, note the following:
- Interface index (
ifIndex) and description (ifDescr) are set according to the RFC 2465 IPv6 MIB. - Interface type (
ifType) is set toOther(no specific type is available). - Interface Name (
ifName), Alias (ifAlias), and Speed (ifSpeed) are blank (not available). - NNMi monitors the Status of this interface, but Performance metrics are not available.
When an IP Address has the Interface Name (
ifName) attribute set to blank, NNMi constructs an alternate string for the IP Address's In Interface attribute (Other[<ifIndex_value>]). - Interface index (
-
Inventory Workspace Views: ![]() See Also
See Also
See IP Address Form for more details about the IP address attributes that appear in this view's column headings.
The Custom IP Addresses view in the Inventory workspace displays most IP address attribute columns. Sort and filter this IP address view to meet your needs, if the views available in NNMi don't provide exactly what you want.
See Use Table Views) for more information about sorting, filtering, and hiding attribute columns within a view.
To display the IP Addresses (All Attributes) view:
- In the Workspaces navigation pane, select the Inventory workspace.
- Select the IP Addresses (All Attributes) view.
For each address displayed in the view, you can identify the status, state, address, mapped address, the name of the interface (In Interface), associated node Name value (Hosted On Node), the subnet in which the address is contained, the subnet prefix length (PL), the date the address status was last modified (Status Last Modified), any notes that exist for the IP address, its direct management mode, the interface direct management mode, the node management mode, date the state of the address was last modified (State Last Modified), date the address was created, date the address was last modified.
Inventory Workspace Views: ![]() See Also
See Also
The MIB Variables view in the Inventory workspace displays all of the MIB variables currently available in NNMi. These MIB Variables provide pieces of information you can gather from devices in your network upon demand.
Your NNMi administrator might choose to load additional MIBs. Check this view periodically to view the latest list of MIB variables available.
See Use Table Views for more information about sorting, filtering, and hiding attribute columns within a view.
To display the MIB Variables view:
- In the Workspaces navigation pane, select the Inventory workspace.
-
Select the MIB Variables view.
Columns in this view show each MIB variable's numeric OID (Object Identifier), Name, Syntax, source MIB, and textual OID.
- Double-click any row to display more details about a MIB Variable. See MIB Variable Form.
- To gather this information from a node, see Use the MIB Browser.
To quickly filter this view for the information you need, consider the following examples:
.1.3.6.1 is the base of the Internet MIB structure.
.1.3.6.1.2.1 is the base of the MIB-2 branch.
.1.3.6.1.3 is the base of all MIB objects that are for experimental purposes.
.1.3.6.1.4.1.9 is the base of all MIB objects provided by Cisco.
.1.3.6.1.4.1.11 is the base of all MIB objects provided by HP.
.1.3.6.1.5 is the base of the Security MIB branch.
.1.3.6.1.6 is the base of the SNMPv2c MIB branch.
Inventory Workspace Views: ![]() See Also
See Also
See Chassis Redundancy Group Form for more details about the attributes that appear in this view's column headings.
The Chassis Redundancy Groups view in the Inventory workspace is useful for identifying the names of the groups that provide redundancy protection against chassis failure.
To display the Chassis Redundancy Groups view:
- In the Workspaces navigation pane, select the Monitoring workspace.
-
Select the Chassis Redundancy Groups View view.
For each Chassis Redundancy Group displayed in this view, you can identify the Chassis Redundancy Group Status, Name, and the date and time the Status was last modified.
See Use Table Views for more information about sorting, filtering, and hiding attribute columns within a view.
To see the incidents related to a Chassis Redundancy Group:
- Double-click the row representing a Chassis Redundancy Group. The Chassis Redundancy Group Form displays all details about the selected Chassis Redundancy Group.
-
Navigate to the Incidents tab.
A table displays the list of Incidents associated with the selected Chassis Redundancy Group.
To view the members that belong to this group:
- Double-click the row representing a Chassis Redundancy Group. The Chassis Redundancy Group Form displays all details about the selected Chassis Redundancy Group.
-
Navigate to the Redundant Chassis tab.
A table displays the list of Chassis that belong to the selected Chassis Redundancy Group.
Inventory Workspace Views: ![]() See Also
See Also
See Card Redundancy Group Form for more details about the attributes that appear in this view's column headings.
The Card Redundancy Groups view in the Inventory workspace shows the groups of redundant cards that your network administrator configured to provide one-to-one redundancy protection against processor card failure.
See Use Table Views for more information about sorting, filtering, and hiding attribute columns within a view.
To display the Card Redundancy Groups view:
- In the Workspaces navigation pane, select the Inventory workspace.
- Select the Card Redundancy Groups View view.
For each Card Redundancy Group displayed in this view, you can identify the Card Redundancy Group Status, Name, and the date and time the Status was last modified.
To see the incidents related to a Card Redundancy Group:
- Double-click the row representing a Card Redundancy Group. The Card Redundancy Group Form displays all details about the selected Card Redundancy Group.
-
Navigate to the Incidents tab to see the incidents associated with the selected Card Redundancy Group.
A table displays the list of Incidents associated with the selected Card Redundancy Group.
To view the members that belong to this group:
- Double-click the row representing a Card Redundancy Group. The Card Redundancy Group Form displays all details about the selected Card Redundancy Group.
-
Navigate to the Redundant Cards tab.
Each Card that belongs to the selected Card Redundancy Group is listed.
Inventory Workspace Views: ![]() See Also
See Also
(NNMi Advanced) Your network administrator might have set up groups of redundant routers to help ensure that information packets reach their intended destination. Use the Router Redundancy Group view to see all of the available groups of redundant routers in your network.
See Router Redundancy Group Form (NNMi Advanced) for more details about the Router Redundancy Group attributes that appear in this view's column headings.
To display the Router Redundancy Group view:
- In the Workspaces navigation pane, select the Inventory workspace or the Monitoring workspace.
- Select the Router Redundancy Group view.
For each Router Redundancy Group displayed in the view, you can identify the Router Redundancy Group status, Router Redundancy Group Name, the Router Redundancy Group protocol (for example, HSRP), and the date the Router Redundancy Group Status was last modified.
To see the incidents related to a Router Redundancy Group:
- Double-click the row representing a Router Redundancy Group. The Router Redundancy Group Form (NNMi Advanced) displays all details about the selected Router Redundancy Group.
- Navigate to the Incidents tab to see the incidents associated with the selected Router Redundancy Group.
To view the members that belong to this group:
- Double-click the row representing the Router Redundancy Group members you want to see.
-
Navigate to the Router Redundancy Members tab.
Each node that belongs to the selected Router Redundancy Group is listed. You also see which interface is assigned to the Router Redundancy Group within each node.
Inventory Workspace Views: ![]() See Also
See Also
Monitoring Workspace Views: ![]() See Also
See Also
Router Redundancy Members View (Inventory) (NNMi Advanced)
Your network administrator might have set up groups of redundant routers to help ensure that information packets reach their intended destination. Use the Router Redundancy Members view to see all of the members of a group of redundant routers in your network.
See Router Redundancy Member Form () for more details about the Router Redundancy Member attributes that appear in this view's column headings.
To display the Router Redundancy Member view:
- In the Workspaces navigation pane, select the Inventory workspace.
- Select the Router Redundancy Members view.
For each Router Redundancy Member displayed in the view, you can identify the Router Redundancy Member Current State, its Previous State, the Router Redundancy Group Name, the hostname on which the Router Redundancy Member resides, the interface that is being used by the router to participate in the Router Redundancy Group (Redundancy Inteface), the IP Address used to exchange the configured Router Redundancy Protocol messages between routers in the Router Redundancy Group (Primary IP), the number used to rank the Router Redundancy Members (Priority), the date and time the Router Redundancy Member State was last modified, and whether the Router Redundancy Member owns the Virtual IP Address for the Router Redundancy Group (for example, VRRPVirtual Router Redundancy Protocol protocol).
Inventory Workspace Views: ![]() See Also
See Also
See Node Group Form for more details about the Node Group attributes that appear in this view's column headings
The Node Groups view in the Inventory workspace is useful for identifying the names of the groups configured by your network administrator.
When checking your network inventory, you might be interested in only viewing information for a particular set of nodes. Your network administrator can group sets of nodes into node groups. An example node group could be all important Cisco routers, or all routers in a particular building. See About Node and Interface Groups for more information about how your administrator sets up node groups. See Filter Views by Node or Interface Group for more information about filtering views using node groups.
Your NNMi administrator can remove the Nodes Group view from the NNMi console. If you are an NNMi administrator, see the "NNMi Console" chapter of the Network Node Manager i Software Deployment Reference for more information.
To display the Node Groups view:
- In the Workspaces navigation pane, select the Inventory workspace.
- Select the Node Groups view.
- To display the definition for a particular Node Group filter, double-click the row representing a Node Group. The Node Group Form displays all details about the selected Node Group.
For each node group displayed in the view, you can identify the node group status, name, whether the node group appears in the filter list for node and interface views, whether the node group is available as a filter in the NNM iSPI Performance software, whether its status is calculated, the date and time its status was last modified, and any notes about the node group.
Inventory Workspace Views: ![]() See Also
See Also
See Interface Group Form for more details about the Interface Group attributes that appear in this view's column headings.
The Interface Groups view in the Inventory workspace is useful for identifying the names of the groups configured by your network administrator.
When checking your network inventory, you might be interested in only viewing information for a particular set of interfaces. Your network administrator can group sets of interfaces into interface groups. See About Node and Interface Groups for more information about how your administrator sets up interface groups. See Filter Views by Node or Interface Group for more information about filtering views using interface groups.
To display the Interface Group view:
- In the Workspaces navigation pane, select the Inventory workspace.
- Select the Interface Groups view.
- To display the definition for a particular Interface Group filter, double-click the row representing an Interface Group. The Interface Form displays all details about the selected Interfaced Group.
For each interface group displayed in the view, you can identify the interface group name, whether the interface group appears in the filter list for interface views, whether the interface group is available as a filter in the NNM iSPI Performance software, node group, and any notes about the interface group.
Inventory Workspace Views: ![]() See Also
See Also
Performance Analysis with Additional Views
Requires Network Node Manager iSPI Performance for Metrics Software (NNM iSPI Performance for Metrics). To populate performance data in the dashboard views or enhance NNM iSPI Performance for Metrics reports by sharing NNMi configuration settings, install the optional Network Performance Server (NPS).
NNMi presents a new workspace in the NNMi console — the ![]() Performance Analysis workspace. The Performance Analysis workspace contains two additional views—Node Performance Metrics and Interface Performance Metrics. These views show details of nodes and interfaces on which performance monitoring is enabled.
Performance Analysis workspace. The Performance Analysis workspace contains two additional views—Node Performance Metrics and Interface Performance Metrics. These views show details of nodes and interfaces on which performance monitoring is enabled.
Within these views, you can see average values of key performance metrics collected from nodes and interfaces on which performance monitoring is enabled. You can launch forms from these views to see detailed status information of each node or interface.
Node Performance Metrics
Requires Network Node Manager iSPI Performance for Metrics Software (NNM iSPI Performance for Metrics). To populate performance data in the dashboard views or enhance NNM iSPI Performance for Metrics reports by sharing NNMi configuration settings, install the optional Network Performance Server (NPS).
The Node Performance Metrics view is useful in analyzing the performance of nodes on which performance monitoring is configured.
For each node displayed, you can identify the average value of each of the following performance metrics:
- CPU 1Min Utilization (avg)
- Memory Utilization (avg)
- Node Reachability (avg)
- Node Availability (avg)
- ICMP Response Time (msec) (avg)
- Buffer Utilization (avg)
- Disk Utilization (avg)
In addition, the view displays the status (critical, major, warning, minor, or normal) of the following metrics:
- CPU 1Min Utilization (avg)
- Memory Utilization (avg)
- Node Availability (avg)
- Buffer Utilization (avg)
- Disk Utilization (avg)
The Status Category Defaults shows the default range of values represented by each status category. You can configure the range of values represented by each status category (see Configure Status Categories).
 Normal
 Minor
Minor Warning
 Major
Major Critical
If no values are retrieved for a metric, the status is shown as Unknown ( ).
).
If you double-click a node, the Node Form opens. This Node Form is identical to the Node Form that you can open from the Node view in the Inventory workspace.
You can filter the rows in this table view by:
- A predefined Node Group
- Time range; available options are: last hour (default), last 12 hours, last day
- Top contributor counts; available options are: 200 (default), 500, 1000
You can right-click a node and click Open Dashboard to launch a dashboard.
To configure the range of values expressed by each status category:
- Log on to the NNMi management server.
-
Go to the following directory:
Windows:
%nnmdatadir%\shared\perfSpi\confLinux:
/var/opt/OV/shared/perfSpi/conf -
Open the
node-performance-range.propertiesfile with a text editor.The default file contains the following content:
cpu1min=0,25,50,75,90,100
memory=0,25,50,75,90,100
bufutil=0,25,50,75,90,100
nodeavail=100,90,75,50,25,0
diskutil=0,25,50,75,90,100
For each metric:
- Normal indicates the range between the first and second numbers
- Minor indicates the range between the second and third numbers
- Warning indicates the range between the third and fourth numbers
- Major indicates the range between the fourth and fifth numbers
- Critical indicates the range between the fifth and sixth numbers
- Make necessary changes to set non-default ranges for each category.
- Save the file. Changes take effect as soon as you refresh the view.
Interface Performance Metrics
Requires Network Node Manager iSPI Performance for Metrics Software (NNM iSPI Performance for Metrics). To populate performance data in the dashboard views or enhance NNM iSPI Performance for Metrics reports by sharing NNMi configuration settings, install the optional Network Performance Server (NPS).
The Interface Performance Metrics view is useful in analyzing the performance of Interfaces on which performance monitoring is configured.
For each Interface displayed, you can identify the average value of each of the following performance metrics:
- Availability (avg)
- Utilization In (avg)
- Utilization Out (avg)
- Throughput In (avg)
- Throughput Out (avg)
- Error Rate In (avg)
- Error Rate Out (avg)
- Discard Rate In (avg)
- Discard Rate Out (avg)
- Queue Drops In (avg)
- Queue Drops Out (avg)
- FCS LAN Error rate (avg)
- FCS WLAN Error Rate (avg)
In addition, the view displays the status (critical, major, warning, minor, or normal) of the following metrics:
- Availability (avg)
- Utilization In (avg)
- Utilization Out (avg)
The Status Category Defaults table shows the default range of values represented by each status category.You can configure the range of values represented by each status category (see Configure Status Categories).
If no values are retrieved for a metric, the status is shown as Unknown ().
If you double-click an Interface, the Interface Form opens. This Interface Form is identical to the Interface Form that you can open from the Interface view in the Inventory workspace.
You can filter the rows in this table view by:
- A predefined Interface Group
- Time range; available options are: last hour (default), last 12 hours, last day
- Top contributor counts; available options are: 200 (default), 500, 1000
You can right-click an interface and click Open Dashboard to launch a dashboard.
To configure the range of values expressed by each status category:
- Log on to the NNMi management server.
-
Go to the following directory:
Windows:
%nnmdatadir%\shared\perfSpi\confLinux:
/var/opt/OV/shared/perfSpi/conf -
Open the
if-performance-range.propertiesfile with a text editor.The default file contains the following content:
availability=100,90,80,70,60,0
utilizationin=0,5,15,25,55,100
utilizationout=0,5,35,45,55,100
For each metric:
- Normal indicates the range between the first and second numbers
- Minor indicates the range between the second and third numbers
- Warning indicates the range between the third and fourth numbers
- Major indicates the range between the fourth and fifth numbers
- Critical indicates the range between the fifth and sixth numbers
- Make necessary changes to set non-default ranges for each category.
- Save the file. Changes take effect as soon as you refresh the view.
See MPLS WAN Cloud (RAMS) form for more details about the attributes that appear in this view's column headings.
(NNMi Advanced, plus Route Analytics Management System (RAMS) for MPLS WAN) The MPLS WAN Connections view provides information about the Layer 3 connectivity between your network and any MPLS networks (for example, an Internet Service Provider MPLS network).
Each MPLS network is represented in the associated topology map by an MPLS WAN Cloud.
Information displayed in the MPLS WAN Clouds (RAMS) view includes the name and Autonomous SystemAn Autonomous System (AS) is a collection of connected Internet Protocol (IP) routing prefixes that present a common, clearly defined Border Gateway Protocol (BPG) routing policy to the Internet by having an officially registered Autonomous System Number (ASN). Number assigned to the MPLS Cloud as well as the number of Customer Edge (CE) routers associated with the MPLS WAN Cloud.
Inventory Workspace Views: ![]() See Also
See Also
Related Topics
The NNMi Causal Engine and Object Status