Searching the Help
To search for information in the Help, type a word or phrase in the Search box. When you enter a group of words, OR is inferred. You can use Boolean operators to refine your search.
Results returned are case insensitive. However, results ranking takes case into account and assigns higher scores to case matches. Therefore, a search for "cats" followed by a search for "Cats" would return the same number of Help topics, but the order in which the topics are listed would be different.
| Search for | Example | Results |
|---|---|---|
| A single word | cat
|
Topics that contain the word "cat". You will also find its grammatical variations, such as "cats". |
|
A phrase. You can specify that the search results contain a specific phrase. |
"cat food" (quotation marks) |
Topics that contain the literal phrase "cat food" and all its grammatical variations. Without the quotation marks, the query is equivalent to specifying an OR operator, which finds topics with one of the individual words instead of the phrase. |
| Search for | Operator | Example |
|---|---|---|
|
Two or more words in the same topic |
|
|
| Either word in a topic |
|
|
| Topics that do not contain a specific word or phrase |
|
|
| Topics that contain one string and do not contain another | ^ (caret) |
cat ^ mouse
|
| A combination of search types | ( ) parentheses |
|
Verify the Monitoring Settings
After the NNMi administrators configure the monitoring settings, configuration for particular objects can be verified to ensure that everything is working correctly. Examples of objects that have Monitoring Settings reports include Nodes, Interfaces, IP addresses, Card, Chassis, SNMP Agent, Web Agent, Router Redundancy Groups, Tracked Objects, Node Sensors, and Physical Sensors. Open the object's form and use the Actions → Configuration Details → Monitoring Settings menu item to display the report.
You can also right-click any object in a table or map view to access the items available within the Actions menu.(NNMi Advanced) If the Global Network Management feature is enabled and you are signed into a Global Manager:
- Node managed by the Global Manager = Actions → Configuration Details → Monitoring Settings opens a report, provided by the Global Manager (NNMi management server).
Node managed by a Regional Manager = Actions → Configuration Details → Monitoring Settings accesses that Regional Manager (NNMi management server) and requests the report.
You must sign into that Regional Manager unless your network environment enables Single Sign-On (SSO) to that Regional Manager through the Global Manager.
- Navigate to the view for that object (for example, Inventory workspace, Nodes) view.
- Select the row representing the object information.
Select Actions → Configuration Details → Monitoring Settings.
NNMi displays the monitoring configuration settings for the selected object.
Note This menu item also is available on any object's form.
- Navigate to a Router Redundancy Group view (for example, Inventory workspace, Router Redundancy Groups view).
- Double-click the row representing the Router Redundancy Group configuration you want to see.
From the Router Redundancy Members tab, double-click the row representing the Router Redundancy Member configuration you want to see.
Select Actions → Configuration Details → Monitoring Settings.
NNMi displays the monitoring configuration settings for the selected object.
- Navigate to a Router Redundancy view (for example, Inventory workspace, Router Redundancy Groups view).
- Double-click the row representing the Router Redundancy Group.
- From the Router Redundancy Members tab, double-click the row representing the Router Redundancy Group Member.
- From the Tracked Objects tab, double-click the row representing the Tracked Object.
Select Actions → Configuration Details → Monitoring Settings.
NNMi displays the monitoring configuration settings for the selected object.
- Navigate to the view for that object (for example, Inventory workspace's Node Sensors view or Physical Sensors view).
- Double-click the row representing the Node Sensor or Physical Sensor Configuration.
Select Actions → Configuration Details → Monitoring Settings.
NNMi displays the monitoring configuration settings for the selected object.
- Open a Layer 2 Neighbor View map of each important interface's parent device. See Viewing Maps (Network Connectivity).
- Each connected interface has a little square symbol around the edge of the parent device's map symbol. For example:
- Hover your mouse over the square to verify the identify of your important interface on the map.
- Verify that the status color of each important interface is not
 Unknown or
  UnmanagedIndicates the Management Mode is "Not Managed" or "Out of Service".. For example:
 - By default, NNMi only monitors the health of connected interfaces. A line appears on the map between interfaces when they are connected. For example:
- To add a connection, see Add or Delete a Layer 2 Connection.
- Open a Layer 3 Neighbor View map of each important parent device. See Viewing Maps (Network Connectivity).
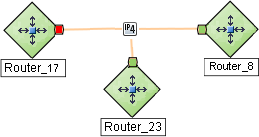
- Each address that is connected to another address in the same subnet has a little hexagon symbol around the edge of the parent device's map symbol. For example:

- Hover your mouse over the hexagon to verify the identify of your important address on the map.
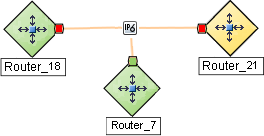
- NNMi monitors the health of addresses only if you enable ICMP Address Monitoring. A line appears on the map between addresses when they are connected. The line represents the subnet. For example:


- If ICMP Address Monitoring is enabled, verify that the status color of each important address is not
 Unknown or
  UnmanagedIndicates the Management Mode is "Not Managed" or "Out of Service".. For example:
- To add a connection, see Add or Delete a Layer 2 Connection.
See Configure NNMi Monitoring Behavior for information about establishing monitoring behavior.
We welcome your comments!
To open the configured email client on this computer, open an email window.
Otherwise, copy the information below to a web mail client, and send this email to network-management-doc-feedback@hpe.com.
Help Topic ID:
Product:
Topic Title:
Feedback:


