


View Traffic-Reporting Nodes
The Traffic Reporting Nodes view shows the list of all nodes on the network that host flow collector interfaces that are capable of sending the traffic data to Leaf Collectors. This topic includes the following sections:
- View Nodes with Threshold Exceptions
- View Node Details
- View the Dashboard for Traffic-Reporting Nodes
- Drill Down for Application Details
- View Traffic Maps for Nodes
- Launch Node Reports
To view the Traffic Reporting Nodes view:
- In the Workspaces navigation pane, select the Traffic Analysis workspace.
- Select the Traffic Reporting Nodes view.
For each node displayed, you can see the following information:
- Threshold State: Threshold state for the node. The states can be Exceeded or Normal.
- Node Name: Hostname of the node that exports flows.
- Traffic Type: Type of traffic data passing through the node.
- Tenant Name: Name of the tenant to which the node is assigned to.
- Traffic Master Server: Fully Qualified Domain Name (FQDN) of the Master Collector that is processing the flows.
When the NNM iSPI Performance for Traffic is configured in GNM, the column displays the FQDN of the regional Master Collector that processes and forwards the flows to the Global Master Collector.
Analysis Pane in the Traffic Reporting Nodes view
The Analysis Pane in the Traffic Reporting Nodes view provides additional details about the selected node.
The Summary Panel displays the analysis period for the traffic reporting interface hosted on the node.
The rightmost pane displays the following tabs:
- Top Apps-In: This tab displays a pie-chart for the applications that contribute to the maximum amount of the outgoing traffic volume for the selected node or interface. The chart shows the distribution of the traffic flow data for the last one hour, with each application represented by a unique color. Click a section to view the application name and its contribution to the total volume of outgoing traffic. Click a section to view the application group name and its contribution to the total volume of outgoing traffic.
- Top Apps-Out Pie Chart: This tab displays a pie-chart for the applications that contribute to the maximum amount of the outgoing traffic volume for the selected node or interface. The chart shows the distribution of the traffic flow data for the last one hour, with each application represented by a unique color. Click a section to view the application name and its contribution to the total volume of outgoing traffic. Click a section to view the application group name and its contribution to the total volume of outgoing traffic.
- Top ToS-In Pie Chart: In this tab, a pie chart displays the top Type-of-Service values that are contributing to the ingress network traffic as reported by all the interfaces hosted on the node.
- Top ToS-Out Pie Chart: In this tab, a pie chart displays the top Type-of-Service values that are contributing to the egress network traffic as reported by all the interfaces hosted on the node.
- Top IP Protocol-In Pie Chart: In this tab, a pie chart displays the top IP protocols that are contributing to the ingress network traffic as reported by all the interfaces hosted on the node.
- Top IP Protocol-Out Pie Chart: : Top IP Protocol-In Pie Chart: In this tab, a pie chart displays the top IP protocols that are contributing to the egress network traffic as reported by all the interfaces hosted on the node.
-
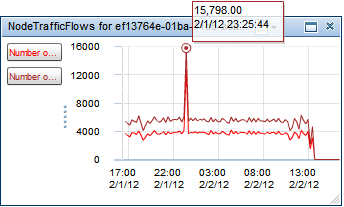
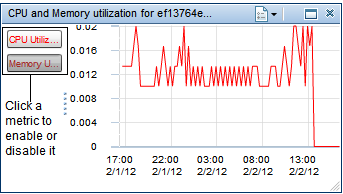
Performance: The Performance tab for a selected flow enabled interface displays the following graphs for the last one day:
These metrics may display different values in these graphs than those displayed in the NNM iSPI Performance for Traffic report graphs, due to different time grain selected for metrics summarization.
You can change the metrics and the time range for these graphs as follows:
To display the metric value for a specific point of time, hover the mouse pointer on the graph:

To display or hide a metric, click the metric name on the legend:

To view the graph as a table, follow these steps:
- Click
 Options.
 - Select View as Table.
To select a date range for the graphs, follow these steps:
- Click
 Show Date Range Panel on the top right corner of the Performance tab.
 -
Click the graph that you want to change.
To apply the new date range on all graphs, select All on the Date Range panel.
- Select a time range for the graphs.
View Nodes with Threshold Exceptions
The Threshold Exceptions Reporting Nodes view shows the list of all nodes on the network that host at least one interface that breached a NNM iSPI Performance for Traffic threshold.
To access the Threshold Exceptions Reporting Interfaces view:
- In the Workspaces navigation pane, select the Traffic Analysis workspace.
- Select the Threshold Exceptions Reporting Nodes view.
For each node displayed, you can see the following information:
- Threshold State: Threshold state for the node. The states can be Exceeded or Normal.
- Node Name: Hostname of the node that exports flows.
- Traffic Type: Type of traffic data passing through the node.
- Tenant Name: Name of the tenant to which the node is assigned to.
- Traffic Master Server: Fully Qualified Domain Name (FQDN) of the Master Collector that is processing the flows.
When the NNM iSPI Performance for Traffic is configured in GNM, the column displays the FQDN of the regional Master Collector that processes and forwards the flows to the Global Master Collector.
For more details about each node, open the Traffic Reporting Node form.
Analysis Pane in the Threshold Breached Reporting Nodes view
The Analysis Panel in the Threshold Breached Reporting Nodes view provides additional details on the selected node.
The Summary pane displays the analysis period for the traffic passing through the node.
The rightmost pane displays the following tabs:
- Click
View Node Details
The Traffic Reporting Node form provides details about the selected traffic-reporting node.
The Threshold Exceptions Reporting Nodes view shows the list of all nodes on the network that host at least one interface that breached a NNM iSPI Performance for Traffic threshold. For information about the nodes that breached a threshold, see Threshold Exceptions Reporting Nodes View.
To view a Traffic Reporting Node form:
- In the Workspaces navigation pane, select the Traffic Analysis workspace.
- Select the Traffic Reporting Nodes view.
- Select a node you want, and click
 Open.
Open.
The General pane of the form enables you to analyze the following information for the selected node:
- Node Name: Name of the node that exports flows
- Traffic Type: Type of the traffic data that the node handles
- Tenant Name: Name of the tenant to which the node is assigned to
The right pane shows the following details for ingress and egress flows collected by the interface:
- Top 5 Sources
- Top 5 Destinations
- Top 5 Conversations
- Traffic Reporting Interfaces
- Applicable Threshold
- Incidents
To view operational details of the interface (and the device that hosts the interface), click  , and then click Open.
The Analysis pane displays additional details on the selected node. For more information about Analysis pane, see Traffic Reporting Nodes View.
View the Dashboard for Traffic-Reporting Nodes
The dashboard for a traffic-reporting node provides a snapshot of the network traffic originating from the node.
To launch the dashboard for a traffic-reporting node, right-click a node in the Traffic Reporting Nodes view (or the Threshold Exceptions Reporting Nodes view) under the Traffic Analysis workspace, and then click Open Dashboard.
This dashboard displays the following tables and charts:
| Dashboard Item | Description |
|---|---|
| Top Applications in Incoming Traffic (Utilization)- Graph |
The graph shows the area graph of the You can select the line, bar, or scatter graph for a detailed analysis. You can do a detailed analysis on an application by launching the Application dashboard. To launch the Application dashboard, click one of the applications listed in this panel. |
| Top Applications in Incoming Traffic (Bytes)- Graph |
The graph shows the area graph of the You can select the line, bar, or scatter graph for a detailed analysis. You can do a detailed analysis on an application by launching the Application dashboard. To launch the Application dashboard, click one of the applications listed in this panel. |
| Top Applications in Outgoing Traffic (Utilization)- Graph |
The graph shows the area graph of the You can select the line, bar, or scatter graph for a detailed analysis. You can do a detailed analysis on an application by launching the Application dashboard. To launch the Application dashboard, click one of the applications listed in this panel. |
| Top Applications in Outgoing Traffic (Bytes) - Graph |
The graph shows the area graph of the You can select the line, bar, or scatter graph for a detailed analysis. You can do a detailed analysis on an application by launching the Application dashboard. To launch the Application dashboard, click one of the applications listed in this panel. |
| Top Destinations in Incoming Traffic (Utilization) - Graph |
The graph shows the area graph of the You can select the line, bar, or scatter graph for a detailed analysis. |
| Top Destinations in Incoming Traffic (Bytes) - Graph |
The graph shows the area graph of the You can select the line, bar, or scatter graph for a detailed analysis. |
| Top Destinations in Outgoing Traffic (Utilization) - Graph |
The graph shows the area graph of the You can select the line, bar, or scatter graph for a detailed analysis. |
| Top Destinations in Outgoing Traffic (Bytes) - Graph |
The graph shows the area graph of the You can select the line, bar, or scatter graph for a detailed analysis. |
| Top Talkers in Incoming Traffic (Bytes) - Report | Ranks top 10 talkers (source-destination pairs) with highest Volume - In Bytes (sum) metric values in a table. |
| Top Talkers in Outgoing Traffic (Bytes) - Report | Ranks top 10 talkers (source-destination pairs) with highest Volume - Out Bytes (sum) metric values in a table. |
| Top Talkers in Incoming Traffic (Utilization) - Report | Ranks top 10 talkers (source-destination pairs) with highest Volume - Utilization metric values in a table. |
| Top Talkers in Outgoing Traffic (Utilization) - Report | Ranks top 10 talkers (source-destination pairs) with highest Volume - Utilization metric values in a table. |
| Top Apps-in - Pie chart | The pie chart shows top six applications with highest Volume - In Bytes (sum) values. |
| Top Apps-out - Pie chart | The pie chart shows top six applications with highest Volume - Out Bytes (sum) values. |
| Top ToS-in - Pie chart | The pie chart shows top six types of service with highest Volume - In Bytes (sum) values. |
| Top ToS-out - Pie chart | The pie chart shows top six types of service with highest Volume - Out Bytes (sum) values. |
| Top IP Protocol-in - Pie chart | The pie chart shows top six protocols with highest Volume - In Bytes (sum) values. |
| Top IP Protocol-out - Pie chart | The pie chart shows top six protocols with highest Volume - Out Bytes (sum) values. |
| Top Sources in Outgoing Traffic (Bytes) - Graph |
The graph shows the area graph of the You can select the line, bar, or scatter graph for a detailed analysis. |
| Top Sources in Incoming Traffic (Bytes) - Graph |
The graph shows the area graph of the You can select the line, bar, or scatter graph for a detailed analysis. |
| Performance | This panel shows the performance graph of the selected node. |
All panels (except for the Performance panel) show the data for the last one hour by default. You can use the Time Filter option to change the time period.
Drill Down for Application Details
To launch the application, launch the traffic-reporting node dashboard, and then click one of the hyper-linked applications listed in dashboard panels.
This dashboard displays the following charts and reports:
| Dashboard Item | Description |
|---|---|
| Top Sources for the Application (Bytes)- Pie Chart |
The pie chart shows top ten sources mapped to this application with highest |
| Top Sources for the Application (Bytes)- Report |
The report shows top ten sources mapped to this application with highest |
| Top Destinations for the Application (Bytes) - Pie Chart |
The pie chart shows top ten destinations mapped to this application with highest |
| Top Destinations for the Application (Bytes) - Report |
The report shows top ten destinations mapped to this application with highest |
| Top Talkers for the Application (Bytes) - Pie Chart |
The pie chart shows top ten talkers (source-destination pairs) mapped to this application with highest |
| Top Talkers for the Application (Bytes) - Report |
The report shows top ten talkers (source-destination pairs) mapped to this application with highest |
| Top Ports for the Application (Bytes) - Report | The report shows top ten ports with highest Total Volume - Bytes (sum) values that are participating in this application traffic. |
View Traffic Maps for Nodes
The NNM iSPI Performance for Traffic maps help you understand traffic flows on your network. NNM iSPI Performance for Traffic maps obtain information from all the nodes that send traffic flow to your network.
The following NNM iSPI Performance for Traffic maps are available in the NNMi console:
You can view all the top destinations and applications that contribute to the traffic flow in your network at any given point of time.
To launch Traffic Path View:
- Log on to the NNMi console.
-
Select the Actions menu in the main toolbar and select Traffic Maps, and then click Traffic Path.
The Traffic Path view opens. The view does not show any maps by default.
- Specify source and destination nodes, and then click
 Get Data.
To launch the Destination and Application Map:
- Log on to the NNMi console.
- Select a traffic-reporting node from one of the nodes inventory views.
-
Select the Actions menu in the main toolbar and select Traffic Maps, and then click Destination and Application Map.
To launch the Top Sources by Destination Map:
- Log on to the NNMi console.
- Select a traffic-reporting node from one of the nodes inventory views.
-
Select the Actions menu in the main toolbar and select Traffic Maps, and then click Top Sources by Destination Map
Launch Node Reports
The Traffic Reporting Nodes inventory enables you to launch NNM iSPI Performance for Traffic reports in the NPS console with the context of a selected node. To launch a report from the inventory, right-click a node in the Traffic Reporting Nodes view (or the Threshold Exceptions Reporting Nodes view), and then select NNM iSPI Performance > Traffic Reports - Report Menu.
Alternatively, after selecting the node of your choice, click Actions > NNM iSPI Performance > Traffic Reports - Report Menu.