Searching the Help
To search for information in the Help, type a word or phrase in the Search box. When you enter a group of words, OR is inferred. You can use Boolean operators to refine your search.
Results returned are case insensitive. However, results ranking takes case into account and assigns higher scores to case matches. Therefore, a search for "cats" followed by a search for "Cats" would return the same number of Help topics, but the order in which the topics are listed would be different.
| Search for | Example | Results |
|---|---|---|
| A single word | cat
|
Topics that contain the word "cat". You will also find its grammatical variations, such as "cats". |
|
A phrase. You can specify that the search results contain a specific phrase. |
"cat food" (quotation marks) |
Topics that contain the literal phrase "cat food" and all its grammatical variations. Without the quotation marks, the query is equivalent to specifying an OR operator, which finds topics with one of the individual words instead of the phrase. |
| Search for | Operator | Example |
|---|---|---|
|
Two or more words in the same topic |
|
|
| Either word in a topic |
|
|
| Topics that do not contain a specific word or phrase |
|
|
| Topics that contain one string and do not contain another | ^ (caret) |
cat ^ mouse
|
| A combination of search types | ( ) parentheses |
|
Examples of Count-Based Threshold Monitoring
There are two alternatives for configuring these example thresholds in NNMi:
- Just provide a few settings (Configure Count-Based Threshold Monitoring for Node Groups and Configure Count-Based Threshold Monitoring for Interface Groups).
- Use the Custom Poller configuration and polling policies to create the required logic (Create Custom Polling Configurations).
Several examples of Count-Based Threshold Settings are presented. These examples are not intended to be recommendations. Consider all aspects of your network environment and set performance thresholds that are meaningful in your environment.
You want to monitor the connections between two sites to verify that your service provider is meeting their guaranteed throughput volume. You pay a fixed cost for a specific bandwidth over this WAN interface.
-
Monitor for under-utilization which wastes money (less than 10%).
Tip If you do not care about under-utilization, set Low Value and Low Value Rearm to 0% as shown in Example 2. The Low Value threshold is then disabled because it cannot be crossed.
- Monitor for over-utilization (greater than 80%), which might result in performance bottlenecks or service provider surcharges.
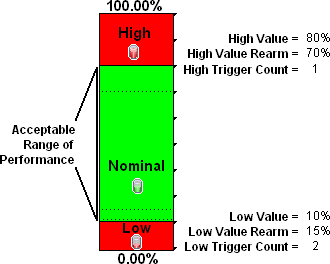
Note Sometimes an Interface's MIB-II ifspeed value is not reported accurately.
- Access the Inventory workspace
- Open Interface view.
- Open the form for the Interface that is reporting a threshold state of "Unavailable."
- Navigate to the General tab.
- Enter a valid entry in Input Speed or Output Speed (this overrides the value returned by the device's SNMP agent so that NNMi can accurately calculate utilization thresholds).
You want to monitor an important Ethernet interface and be notified if it is getting overloaded.
An Ethernet interface configured for full-duplex operation has an acceptable operating range of 0-60%. When average utilization is greater than 60%, you want NNM to generate a High Threshold incident.
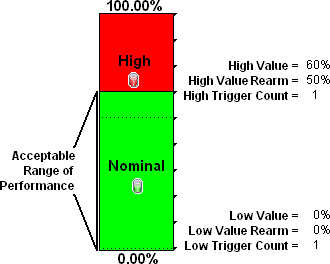
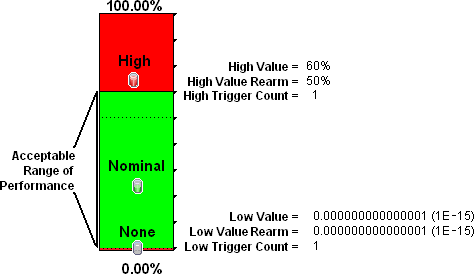
You want to monitor an important Ethernet interface and be notified if it is getting overloaded or if no data has passed through the interface during the polling interval. This might indicate a problem with the interface or its connection. If a formerly connected interface is Administratively Down, NNMi honors that and does not generate a fault condition.
This example monitors for the following:
- When the average utilization is greater than 60%
-
When zero data is passing through the interface
Tip The Low Value of 0.000000000000001 used in this example because it is the smallest value greater than zero available in NNMi. When you configure a Threshold, to use this value, simply type
1E-15and press Enter. NNMi converts that Scientific Notation to the text string 0.000000000000001 (with 1 entered in the 15th position after the decimal).
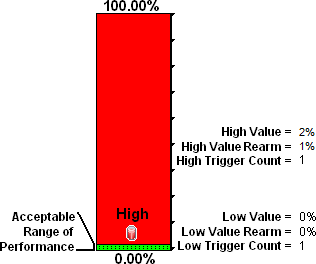
You want to know any time an interface is dropping data. The acceptable limit for interface discards is 10%. A High Threshold situation occurs when the discard rate exceeds 10% and returns to Nominal when the discard rate drops below 5%.
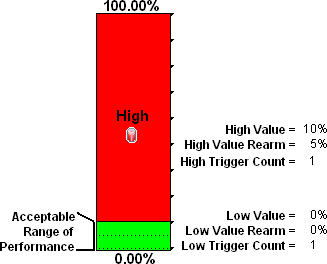
You want to know if packet errors occur. The acceptable limit for packet errors is 2%. A High Threshold situation occurs when the error rate exceeds 2% and returns to normal when the error rate drops below 1%.
Tip To monitor for any errors greater than zero, set the High Value, High Value Rearm, Low Value, and Low Value Rearm to: 0.0
We welcome your comments!
To open the configured email client on this computer, open an email window.
Otherwise, copy the information below to a web mail client, and send this email to network-management-doc-feedback@hpe.com.
Help Topic ID:
Product:
Topic Title:
Feedback:


