Searching the Help
To search for information in the Help, type a word or phrase in the Search box. When you enter a group of words, OR is inferred. You can use Boolean operators to refine your search.
Results returned are case insensitive. However, results ranking takes case into account and assigns higher scores to case matches. Therefore, a search for "cats" followed by a search for "Cats" would return the same number of Help topics, but the order in which the topics are listed would be different.
| Search for | Example | Results |
|---|---|---|
| A single word | cat
|
Topics that contain the word "cat". You will also find its grammatical variations, such as "cats". |
|
A phrase. You can specify that the search results contain a specific phrase. |
"cat food" (quotation marks) |
Topics that contain the literal phrase "cat food" and all its grammatical variations. Without the quotation marks, the query is equivalent to specifying an OR operator, which finds topics with one of the individual words instead of the phrase. |
| Search for | Operator | Example |
|---|---|---|
|
Two or more words in the same topic |
|
|
| Either word in a topic |
|
|
| Topics that do not contain a specific word or phrase |
|
|
| Topics that contain one string and do not contain another | ^ (caret) |
cat ^ mouse
|
| A combination of search types | ( ) parentheses |
|
Examples of Time-Based Threshold Monitoring
There are two alternatives for configuring these example thresholds in NNMi:
- Just provide a few settings (Configure Time-Based Threshold Monitoring for Node Groups and Configure Time-Based Threshold Monitoring for Interface Groups).
- Use the Custom Poller configuration and polling policies to create the required logic (Create Custom Polling Configurations).
Several Time-Based Threshold Settings examples are presented. These examples are not intended to be recommendations. Consider all aspects of your network environment and set performance thresholds that are meaningful in your environment.
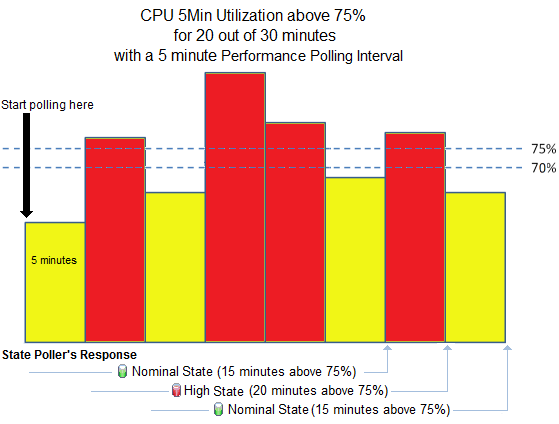
You want to know when the CPU Utilization is above 75% for 20 out of 30 minutes. A High Threshold situation occurs when the CPU Utilization exceeds 75% for 20 out of 30 minutes and returns to normal when the Utilization drops below 70%.
High Value: 75%
High Value Rearm: 70%
High Duration: 20 minutes
High Duration Window: 30 minute
Polling Interval: 5 minutes
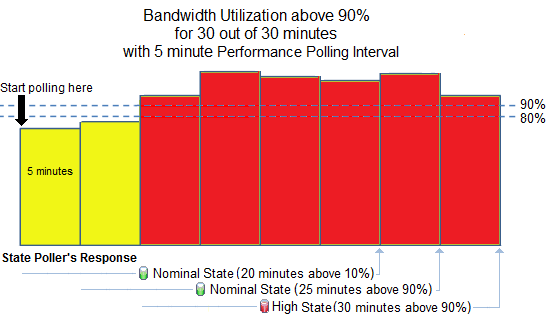
You want to know when the Bandwidth Utilization is above 90% for 30 out of 30 minutes. A High Threshold situation occurs when the bandwidth utilization exceeds 90% for 30 out of 30 minutes and returns to normal when the utilization drops below 80%.
High Value: 90%
High Value Rearm: 80%
High Duration: 30 minutes
High Duration Window: 30 minutes
Polling Interval: 5 minutes
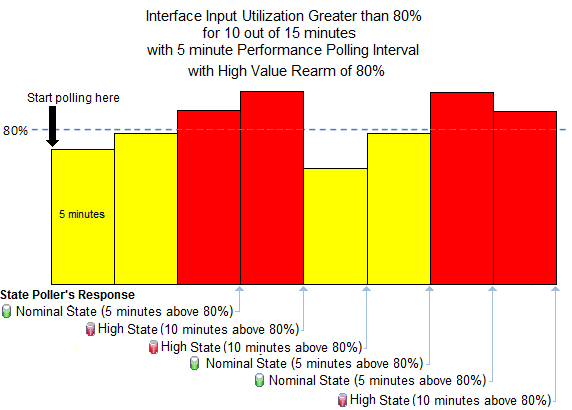
You want to reduce the frequency of interface State changes when the polled value is close to the threshold.
The first example shows the Performance Polling results with High Value Rearm set to 80% (same percentage as the threshold).
High Value: 80%
High Value Rearm: 80%
High Duration: 10 minutes
High Duration Window: 15 minutes
Polling Interval: 5 minutes
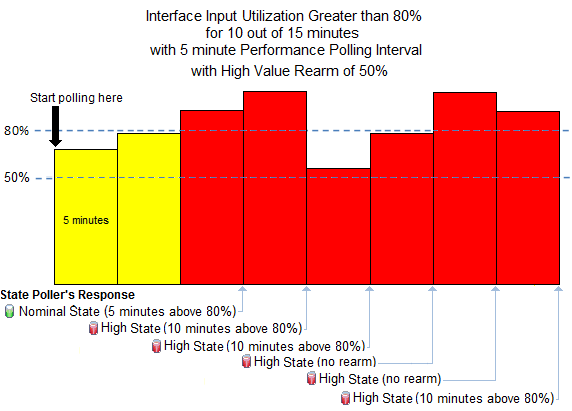
The second example shows the same set of Performance Polling results with High Value Rearm set to 50%.
High Value: 80%
High Value Rearm: 50%
High Duration: 10 minutes
High Duration Window: 15 minutes
Polling Interval: 5 minutes
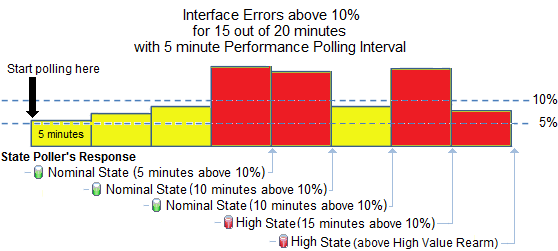
You want to know when the Interface Errors are above 10% for 15 out of 20 minutes. A High Threshold situation occurs when the interface errors exceed 10% for 15 out of 20 minutes and returns to normal when the interface errors drops below 5%.
High Value: 10%
High Value Rearm: 5%
High Duration: 15 minutes
High Duration Window: 20 minutes
Polling Interval: 5 minutes
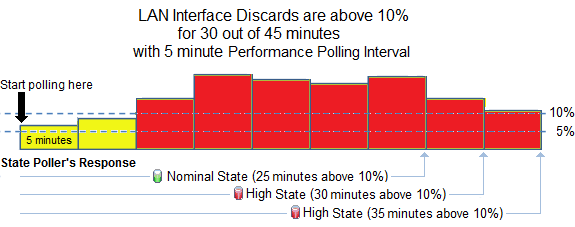
You want to know when the Interface Discards are above 10% for 30 out of 45 minutes. A High Threshold situation occurs when the interface discards exceed 10% for 30 out of 45 minutes and returns to nomral when the interface discards drop below 5%.
High Value: 10%
High Value Rearm: 5 %
High Duration: 30 minutes
High Duration Window: 45 minutes
Polling Interval: 5 minutes
We welcome your comments!
To open the configured email client on this computer, open an email window.
Otherwise, copy the information below to a web mail client, and send this email to network-management-doc-feedback@hpe.com.
Help Topic ID:
Product:
Topic Title:
Feedback:


