


This topic includes the following sections:
- Launch a Dashboard View from the Dashboard Workspace
- Dashboard Views based on an Object
- Launch an Object-based Dashboard View
- Customize a Dashboard View
NNMi includes dashboard views, which, depending on the dashboard type, can contain multiple panels of data pertaining to the entire network, a specific object (for example, a node or interface), or a group of objects (such as a Node Group or Interface Group).
Dashboard views provide at-a-glance information, allowing you to easily compare and quickly isolate the information you need. Dashboard panels can contain tables and charts, some of which might be customizable. See Customize a Dashboard View.
There are two types of dashboard views:
- Dashboard Views available in the Dashboards Workspace:
These views contain information scoped to the entire set of objects managed by this NNMi management server, constrained by the Security Groups to which the logged-in user belongs. - Dashboard Views based on an Object:
These views are scoped to a selected object. These are also further scoped by the Security Groups to which the logged-in user belongs.
For more information about dashboards: ![]() See Also
See Also
To launch a dashboard view from the Dashboards workspace:
- From the workspace navigation panel, click the Dashboards workspace.
- Select the desired dashboard view.
For more information about dashboards: ![]() See Also
See Also
Object-based dashboard views include a wealth of information about the selected object. The dashboard view presents at-a-glance information, allowing you to easily compare and quickly isolate the information you need to investigate and identify network problems:
- Dashboard panels can contain graphs, gauges, maps, and tables.
- Smart Plug Ins (iSPIs) add more information to the Dashboards, for example performance data might also be displayed. See About the Smart Plug Ins (iSPIs).
For more information about dashboards: ![]() See Also
See Also
There are multiple ways to access an object-specific Dashboard view:
- Table views: Right-click any row in a table and select Open Dashboard.
- Map views: Right-click any map object and select Open Dashboard.
- Form's Analysis panel: Click any underlined item in a chart's legend to launch a customized Dashboard view specific to that selected object.
- Dashboard panels: Click any underlined item in a chart's legend to launch a customized Dashboard view specific to that selected object.
Smart Plug Ins (iSPIs) add more information to the Dashboards, for example performance data for Nodes and Interfaces. See About the Smart Plug Ins (iSPIs).
After you display a dashboard, you can return to the previous screen using the breadcrumbs in the title bar.
For more information about dashboards: ![]() See Also
See Also
Some panels in Dashboard views can be filtered for a certain time period by using the Time Filter.
|
Drop-down in the top right corner of the Dashboard view:
|
Fine-tune bar:
|
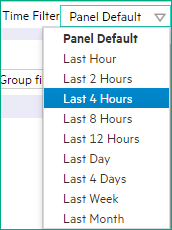
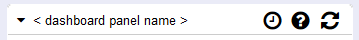
All panels that acknowledge the Time Filter setting display data according to the currently selected period in the Time Filter drop-down at the top of the Dashboard view and have the  icon on the top right corner of their panel toolbar:
By default, these panels display data for the last four hours.
You can customize a dashboard view in the following ways:
- Customize Charts
- Minimize or Restore Dashboard Panels
For more information about dashboards: ![]() See Also
See Also
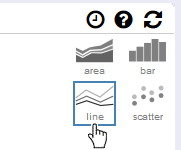
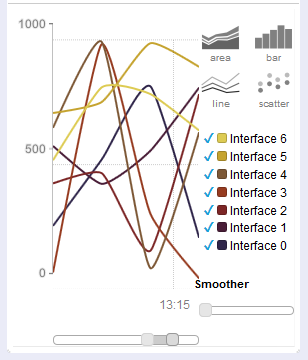
Certain dashboard panels display customizable area, bar, line, or scatter charts. Change the chart type by clicking one of the controls provided in the upper-right portion of the panel (choices might include area, bar, line, and scatter):
To customize a chart, do the following:
Click an underlined item in the chart Legend to launch a new Dashboard specific to that object. Click the checkmarks in the chart Legend to show or
  hide a subset of objects:
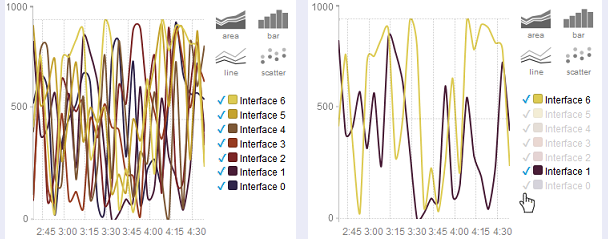
 Click a color tile in the chart Legend to instantly display only one specific object:
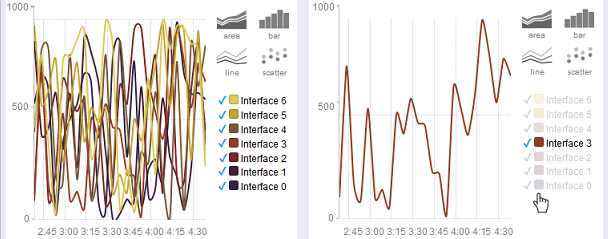
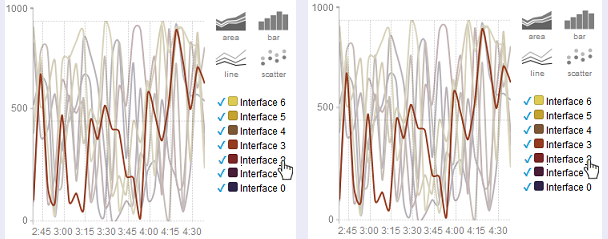
Hover the cursor:
- Over the component list to instantly view data for one particular component.
- Over the chart to display a particular value at a particular time.
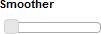
- Smooth the appearance of a chart by clicking and dragging the button in the Smoother control.
Isolate the view to a particular timeframe by clicking and dragging the buttons on the slider beneath the chart under the time captions:
For more information about dashboards: ![]() See Also
See Also
Minimize a dashboard panel by clicking the  button available in the upper-left corner of a given panel's title bar.
Restore a dashboard panel by clicking the  button available in the upper-left corner of a given panel's title bar.
For more information about dashboards: ![]() See Also
See Also