


This topic includes the following sections:
- Understand Maps
- Navigate Maps
- Refresh Node Status on a Map
- Control Tool Tips Information on a Map
- Access Maps Provided by NNMi
A map view is a powerful way to display information about your network. In a map view, nodes, interfaces, IP address, and subnets are represented as symbols on the map. The lines between the nodes and interfaces represent the connection or relationship between these objects.
For each symbol, a background shape indicates the type of device, such as router or switch. See About Map Symbols. The color of this background shape indicates the current health of the device. See About Status Colors for more information about map color values.
On the maps, a foreground image is placed over the background shape. The foreground image identifies the make and model of the network device.
You access map views from the Topology Maps and Troubleshooting workspaces. You can also open maps from table views using the Actions menu. See Access Maps Provided by NNMi and Use Actions to Perform Tasks for more information.
You can also right-click any object in a table or map view to access the items available within the Actions menu.Depending on the type of map you are viewing, NNMi uses additional conventions to depict other kinds of objects on the map:
Layer 2 Neighbor View Map Objects
Layer 3 Neighbor View Map Objects
Some NNMi users can delete nodes and other objects from the NNMi database (depending on the assigned NNMi Role). Any node that has been deleted appears as a transparent icon to all NNMi users until their map is refreshed using the  Refresh icon. After Refresh, the deleted node is removed from the map. NNMi does not automatically refresh the connectivity or set of nodes in a map view, except on the Initial Discovery Progress and Network Overview maps.
You can perform the following operations in a map view:
- Access More Information About an Object (Forms and Analysis Pane)
- Refresh a View
- Change the Map Layout
- Adjust the Zoom Factor
- Pan Around the Map
- Set the Location of the Overview Pane
- Select Highlight Options for VLAN Maps
- Find a VLAN for Highlighting VLAN Maps
- Refresh Node Status on a Map
- Control Tool Tips Information on a Map
If you use the Mozilla Firefox browser and have any timeout issues; for example, being prompted to click Continue before a map appears, see Configure Mozilla Firefox Timeout Interval.
Understand Maps
To understand how to interpret the contents of maps provided by NNMi, you want to know the following:
This topic includes the sections:
- About Status Colors
- About Map Symbols
- Node Group Map Objects
- Layer 2 Map Objects
- Layer 3 Map Objects
- Path View Map Objects
The color of the background shape of each map symbol conveys the most recent health status of that Node. The color of each connection icon (the line) conveys the most recent health of communication between the two Nodes (determined by evaluating the status of each Interface or IP address involved). At the end of each connection line, the color of each interface icon (small square) or IP address icon (small hexagon) also conveys its most recent health status. For example:
NNMi calculates the appropriate Status for objects:
NNMi's Causal Engine collects the data for calculating each object's Status value. Using the State information collected by the State Poller as well as this additional information, the Causal Engine calculates the Status of each Node, Interface, and SNMP agent.
- State = This value is provided by the NNMi State Poller and is always up to date for each object.
- Status = This value can run behind by the amount of time listed for Delay Processing Input in the System Information dialog's Causal Engine tab. See System Information: Causal Engine tab and Verify Current Status of a Device.
NNMi displays the status color within background shapes on map objects that represent Nodes (devices) within your network.
The following table describes the meaning of each potential status color.


Status Color for Aggregator Objects (NNMi Advanced)
Link Aggregation protocols enable network administrators to configure a set of interfaces on a switch to function as one. This technique of combining multiple interfaces increases bandwidth, the speed at which data travels, and provides redundancy.

On a Layer 2 map, a thick line with a superimposed ellipse represents a Link AggregationProtocols used on Switches to configure multiple Interfaces (Aggregation Member Interfaces) to function as if they were one (an Aggregator Interface). When two Aggregator Interfaces establish a connection, that connection is an Aggregator Layer 2 Connection. The Aggregator Layer 2 Connection appears on Layer 2 Neighbor View maps as a thick line with an Interface icon at each end (representing the Aggregator Interface). or Split Link AggregationLink Aggregation with more than two endpoints. Some vendors refer to this as Multi-Chassis Link Aggregation, SLAG, MLAG, or MC-LAG. (group of multiple Layer 2 Connections that are functioning as one). The icon representing an Interface at either end of the thick line is an Aggregator Interface (a logical interface comprised of many physical interfaces that are functioning as one).
Two endpoints:
| Three endpoints:
| More than three endpoints:
|

See Layer 2 Map Objects for more information.
The following table describes the meaning of each potential status color for an Aggregator Interface.
Status Color for Network Connections
Map lines indicate network connections. The color of these lines indicates current status. There are three types of lines on NNMi maps that indicate network communication paths:
Single connection lines from one interface to another (network Layer 2 communications) or from one address to another (network Layer 3 communications).
Multiconnection lines save space on complex NNMi maps. The NNMi administrator configures how many single connections dynamically condense into one thick line.
Aggregate connection lines are thick lines with a superimposed ellipse representing a group of multiple connections that are functioning as one.
The following table describes the meaning of each potential status color for a single network connection.
Special icons within the line indicate additional information.
| Color | Meaning | Description |
|---|---|---|
 | Unknown | Indicates that due to other network problems, the status of one interface cannot be determined at this time. |
 | Normal | Indicates both interfaces in the connection are responding. |
 | Warning | Indicates there might be a problem with either interface. |
 | Minor | Indicates the interface on one end is not responding. The interface on the other end is responding. |
 | Critical | Indicates neither interface or IP address is responding. |
 | Disabled | Indicates one or both interfaces are administratively disabled. |
 | No Status | Indicates one of the following:
|
Multiconnection line:
| Expanded to show the group of single connections:
|
- No Interface or IP address icon appears at either end of the thick line.
- To view the individual connections and the associated interfaces or IP addresses within a multiconnection, double-click the multiconnection line of interest.
- To collapse the expanded group of member connections, use the Refresh icon to refresh the map.
- To popup summary information about the multiconnection, move the mouse cursor over the multiconnection of interest.
The following table describes the meaning of each potential status color for a multiconnection line.
| Color | Meaning | Description |
|---|---|---|
 | Unknown | Indicates that all connections in the multiconnection have a Status of Unknown. |
 | Normal | Indicates that all connections in the multiconnection have a Status of Normal. |
 | Warning | Indicates one of the following:
|
 | Major | All connections but one in the multiconnection have a Status of Critical. One connection has a Status of either Normal, Warning, Minor, or Major. |
 | Minor | Indicates all connections but one in the multiconnection are Normal. The Status of one connection is Minor, Warning, or Critical. |
 | Critical | Indicates that all connections in the multiconnection have a Status of Critical. |
 | Disabled | Indicates that all connections in the multiconnection have a Status of Disabled. |
 | No Status | Indicates that all connections in the multiconnection have a Status of No Status. |
Aggregate Connections (NNMi Advanced)
Thick lines with a superimposed ellipse represent Link AggregationProtocols used on Switches to configure multiple Interfaces (Aggregation Member Interfaces) to function as if they were one (an Aggregator Interface). When two Aggregator Interfaces establish a connection, that connection is an Aggregator Layer 2 Connection. The Aggregator Layer 2 Connection appears on Layer 2 Neighbor View maps as a thick line with an Interface icon at each end (representing the Aggregator Interface). or Split Link AggregationLink Aggregation with more than two endpoints. Some vendors refer to this as Multi-Chassis Link Aggregation, SLAG, MLAG, or MC-LAG. protocol usage (a group of multiple connections that are functioning as one). The icon representing an Interface at either end of the thick line is an Aggregator Interface (a logical interface comprised of many physical interfaces that are functioning as one).
Two endpoints:
| Three endpoints:
| More than three endpoints:
|
The following table describes the meaning of each potential status color for an Aggregator Layer 2 Connection. See Layer 2 Map Objects for more information.
| Color | Meaning | Description |
|---|---|---|
| Unknown | Indicates all of the participating Aggregation Member Layer 2 Connections are unreachable and cannot be polled. |
| Normal | Indicates all of the participating Aggregation Member Layer 2 Connections have a Status of Normal. |
| Minor | Indicates at least one (but not all) of the participating Aggregation Member Layer 2 Connections has a Status of Critical. |
| Major | All connections but one of the participating Aggregation Member Layer 2 Connections has a Status of Critical. One connection has a Status of either Normal, Warning, Minor, or Major. |
| Critical | Indicates all of the participating Aggregation Member Layer 2 Connections have a Status of Critical. |
| Warning | WENDY: DOES Warning EVER APPLY TO AGGREGATE LINKS? Need description. Indicates one of the following:
|
| Disabled | Indicates all of the participating Aggregation Member Layer 2 Connections are administratively down. |
 | No Status | Indicates one of the following:
|
Map symbols convey the following information:
- The background shape and foreground image of map icons indicate the type of device being depicted.
The lines between devices indicated network connections. Special icons within those lines indicate additional information.
For more information: ![]() See Also
See Also
Map symbols represent nodes or node groups. Each map symbol that represents a single node has a background shape and a superimposed foreground image (default images are shown in the table below). Custom foreground images might represent specific vendors and models.
The NNMi administrator can customize the NNMi foreground image for each Device Profile. Therefore, you might see foreground images that are not described in the following table. Contact your NNMi administrator if you have questions about any additional foreground shapes.
The color of the background shape indicates the most recent health status of the device (see Status Color for Objects and Status Color for Aggregator Objects (NNMi Advanced)).
| Background Shape | Foreground Image \ Meaning | Background Shape | Foreground Image \ Meaning |
|---|---|---|---|
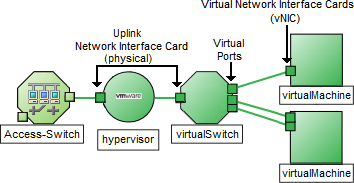
 | Hypervisor (NNMi Advanced) The virtual machine manager in charge of delegating various aspects from a pool of resources to become virtual devices. When you double-click the hypervisor map icon, the displayed form includes a Hosted Nodes tab listing the virtual devices being provided. The virtual devices provided by the hypervisor have a Hosted On attribute that identifies which hypervisor provided the resources. |  |
Note Other includes non-SNMP nodes. |
 |
|  |  = Gateway = Gateway = Hub = Hub = Router = Router = Switch-Router = Switch-Router = Voice Gateway = Voice Gateway |
 |
|  | Multiple Chassis inside:
|
 | Multiple Chassis inside:
|  | Multiple Chassis inside:
|
 |  = Analyzer = Analyzer = Firewall = Firewall = Load Balancer = Load Balancer = Network Appliance = Network Appliance = Power Supply = Power Supply = Printer = Printer = Wireless Access Point = Wireless Access Point |  |  = IP Phone = IP Phone |
 | Child Node Group (no foreground image) |
 = Computer
 = Server
 = Workstation
 = Other
 = ATM Switch
 = Switch
 = Chassis
 The icons in the following table provide valuable information about certain connection lines between devices within your network. There are various types of communication channels within networks. The lines between map objects provide valuable information about both the type of connection and current health of that connection. See Status Color for Network Connections for more information.
When you click a connection line, NNMi displays the port number at each end of the selected connection:
- Press p to toggle the port number off or on.
- Press n to toggle the device names off or on.
| Icon | Meaning | |
|---|---|---|
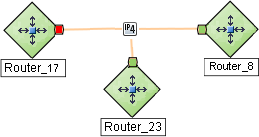
 | Used in maps to represent Point-to-Multipoint (a connection with multiple interfaces) when NNMi detects a shared media, such as a hub or a mesh, connecting multiple devices. If you double-click the line or the
| |
 | Used in maps to represent Point-to-Multipoint (a connection with multiple interfaces) Layer 3 edge connectivity across wide-area-networks (WANs). The  icon (in prior NNMi releases the icon (in prior NNMi releases the  icon) represents an unidentified set of devices between two nodes on the map (most likely a Service Provider's network or WAN). icon) represents an unidentified set of devices between two nodes on the map (most likely a Service Provider's network or WAN). NNMi accomplishes this by following special rules for subnets with prefix lengths between 28 and 31. These special rules are called Subnet Connection Rules. NNMi administrators can configure these rules. If you double-click the line or the
| |
 | Used in maps to represent IPv4 subnets.
| |
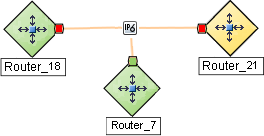
 | (NNMi Advanced) Used in maps to represent IPv6 subnets.
| |
 | (NNMi Advanced) In Layer 2 maps, a thick line with a superimposed ellipse represents Link AggregationProtocols used on Switches to configure multiple Interfaces (Aggregation Member Interfaces) to function as if they were one (an Aggregator Interface). When two Aggregator Interfaces establish a connection, that connection is an Aggregator Layer 2 Connection. The Aggregator Layer 2 Connection appears on Layer 2 Neighbor View maps as a thick line with an Interface icon at each end (representing the Aggregator Interface).. See Layer 2 Map Objects. | |
 | (NNMi Advanced) In Layer 2 maps, the
| |
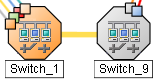
| In Layer 2 maps, these icons indicate that the object contains more than one Chassis.
Lines within the expanded object convey special meaning:
| Node contains more than one chassis: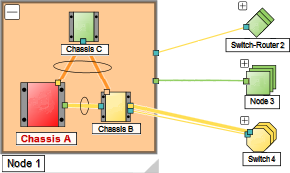 |
Switch contains more than one Chassis.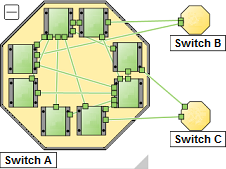 | ||
Switch-Router contains more than one Chassis.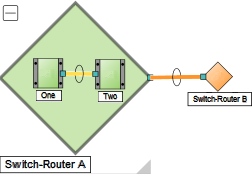 | ||
| (NNMi Advanced) In Layer 2 maps, this icon represents the hypervisorThe virtual machine manager in charge of delegating various aspects from a pool of resources to become virtual devices. The delegations might be static or dynamic, depending on the manufacture's implementation. The type of virtual machines being generated depends on the manufacturer's implementation. (virtual machine manager) in charge of delegating various aspects from a pool of resources to become virtual devices. | Here is one example:
|
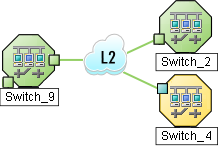
 | Used in Path Views if NNMi detects a connection, but cannot verify the device's identification (no response to SNMP), that device is indicated on the map by a the (in prior NNMi releases the  icon) cloud symbol. icon) cloud symbol.
For more information, see Path View Map Objects. | |
 | [[This text is displayed in "About Map Symbols" (nmConVwsMap0800Symbols.htm) in the Icons for Special Connections table. The text describes symbols customers will see in the MPLS WAN Clouds Map (RAMS).] (NNMi Advanced, plus Route Analytics Management System (RAMS) for MPLS WAN) Used in RAMS MPLS WAN Map views. If NNMi detects an MPLS connection across the network, it is indicated on the map by a cloud symbol.
If you are an NNMi administrator, also see RAMS MPLS WAN Configuration (NNMi Advanced) for more information. | |
Node Group maps show members of a Node Group (as defined by the NNMi administrator). Each Node Group Map shows either Layer 2 or Layer 3 information.
The map displays the status of each member, connection, and Child Node Group. To provide context for your environment, the NNMi administrator might also add a background image (for example, a map of North America).
NNMi can enlarge the map symbol of any node associated with a Key IncidentIncidents with both: (1) Severity = other than Normal. (2) Correlation Nature = equal to Root Cause, Service Impact, Stream Correlation, Rate Stream Correlation, Info, or None.. Use the Indicate Key Incidents button in the map view toolbar (see Using the View Toolbars: Node Group Map Toolbar Icons):
 (on) = When the this Node Group map opens, NNMi enlarges any objects on a Node Group map that are Source Objects for a Key IncidentIncidents with both: (1) Severity = other than Normal. (2) Correlation Nature = equal to Root Cause, Service Impact, Stream Correlation, Rate Stream Correlation, Info, or None.. (For example, when viewing the Node Group map, NNMi enlarges any node on a Node Group map that has an open root cause incident associated with it.)
 (off) = When the this Node Group map opens, NNMi does not indicate the objects on a Node Group map that are Source Objects for a Key IncidentIncidents with both: (1) Severity = other than Normal. (2) Correlation Nature = equal to Root Cause, Service Impact, Stream Correlation, Rate Stream Correlation, Info, or None..
To view the associated incident for the node, double-click the node symbol. In the Node form, select the Incidents tab.
Because these maps are based on Node Groups rather than connectivity, some nodes might not have any connections on the map.
A hexagon (as shown below) indicates a Child Node Group:

A gray halo around a map icon indicates a device that is one-hop outside of the displayed Node Group (connected to a Node Group member, but not itself a member). Not all one-hop neighbors are displayed. Your NNMi administrator must configure the Node Group map to show one-hop neighbors if those neighbors are members of the particular Node Group used as the filter.

See Views Available in NNMi for information about the Node Group maps that NNMi provides.
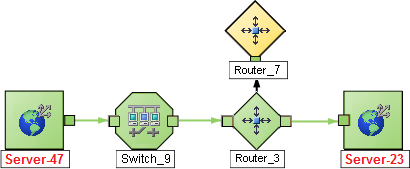
Layer 2 maps show a map view of a selected device and any connected devices within a specified number of hops from the selected device. This is useful for understanding the switch connectivity between devices. See "Help for Operators" for more information.
During discovery, NNMi reads the Forwarding Database (FDB) tables from Ethernet switches within a network to help NNMi determine communication paths between network devices. NNMi searches these FDB tables for information about discovered nodes. When an NNMi management server finds FDB references to duplicate MAC addressesThe Media Access Control address (hardware address or physical address) that the factory burns into a network adapter or device with built-in networking capability. A MAC address has six pairs of hexadecimal digits, separated by colons or dashes. For example 02:1F:33:16:BC:55:
If two or more discovered nodes contain an interface associated with the same Media Access Control (MAC) address within the same Tenant or with one of those nodes in Default Tenant and one in any other Tenant, NNMi disregards the communication paths reported for those duplicate MAC addresses in the FDB. This might result in missing connections on NNMi maps in network areas that include those duplicate MAC addresses.
(NNMi Advanced - Global Network Management feature) If two NNMi management servers discover nodes that contain an interface associated with the same Media Access Control (MAC) address, the Global NNMi management server's maps could be missing connections that are visible on the Regional NNMi management server's maps.
- If a single node contains multiple interfaces that have the same MAC address, NNMi gathers all communication path information for those interfaces and displays that information on NNMi maps.
Forwarding Database (FDB) information can cause NNMi to establish wrong Layer 2 Connections in the following cases:
- When the FDB is configured as cache and contains obsolete data.
- In network environments with hardware from a variety of vendors, when each vendor generates different and sometimes conflicting FDB data.
Optional: NNMi administrators can configure Spiral Discovery to ignore the FDB data from one Node Group when calculating Layer 2 Connections (the FDB data is still included in other calculations).
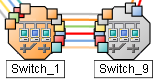
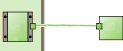
For example, in Layer 2 Neighbor View maps, interfaces are indicated by little squares around the background shape of the parent node. Each interface also has a status color. Green indicates the interface is working properly. Red indicates the interface is down.
| Connection Lines | Meaning of Connection Line |
|---|---|
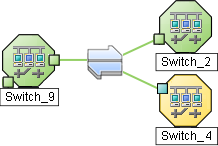
| Thin lines between devices indicate communication channels between the two devices (connections). The lines also show status color indicating the current health of that connection. See Status Color for Objects. |
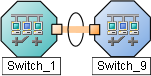
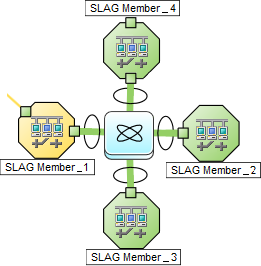
| Double-click the thick line to expand the group of individual links. |
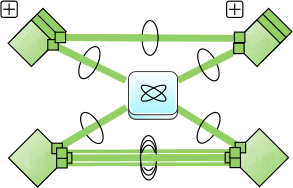
Two endpoints: Three endpoints: More than three endpoints: | (NNMi Advanced) Thick lines (connections) with an ellipse around them indicate Link AggregationProtocols used on Switches to configure multiple Interfaces (Aggregation Member Interfaces) to function as if they were one (an Aggregator Interface). When two Aggregator Interfaces establish a connection, that connection is an Aggregator Layer 2 Connection. The Aggregator Layer 2 Connection appears on Layer 2 Neighbor View maps as a thick line with an Interface icon at each end (representing the Aggregator Interface). protocols are in use. These protocols enable network administrators to configure a set of interfaces on a switch as one Aggregator Interface, creating an Aggregator Layer 2 Connection to another device using multiple interfaces in parallel to increase bandwidth, increase the speed at which data travels, and increase redundancy. Double-click the thick line (the Aggregator Layer 2 Connection) to open the Layer 2 Connection form for more information. NNMi calculates the status of the thick line (Aggregator Layer 2 Connection) based on the status of the entire group of Aggregation Member Layer 2 Connections. See Status Color for Aggregator Objects () for more information. When the link aggregation has more than two endpoints, NNMi depicts the link as a Split Link AggregationLink Aggregation with more than two endpoints. Some vendors refer to this as Multi-Chassis Link Aggregation, SLAG, MLAG, or MC-LAG. (SLAG) group of links. |
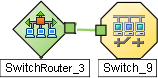
Node: Switch: Switch-Router: | These icons indicate that the device contains more than one
|
Hypervisor(NNMi Advanced): | In Layer 2 maps, this icon represents the virtual machine manager in charge of delegating various aspects from a pool of resources to become virtual devices.
|
See "Help for Operators" for more information about Layer 2 maps.
Layer 3 maps show a selected device and its connected devices within a specified number of hops from the selected device. This view is useful for understanding the router connectivity between devices.
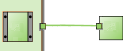
For example, in Layer 3 Neighbor View maps, addresses connected to neighbors within the same subnet are indicated by hexagons around the background shape of the parent node. Each address has a status color. Green indicates the address is working properly. Red indicates the address is not responding. The line between devices indicates the subnet. The subnet does not have any status:
(NNMi Advanced) IPv6 subnets are indicated by this symbol:
See "Help for Operators" for more information about Layer 3 Neighbor View maps.
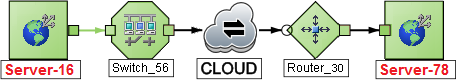
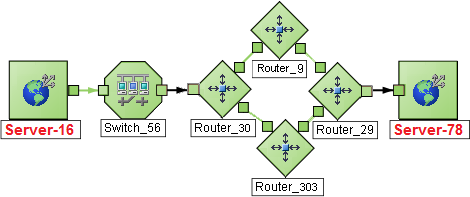
Path View maps show an active network path between a source and destination end point.
The main objects in the displayed path in a Path View map are routers and switches.
Do not specify a switch as a Source or Destination node in Path View maps. To view connectivity between switches, use the Layer 2 Neighbor View.When NNMi cannot determine the nodes within a portion of the path, it uses a Cloud object as shown in the example below:
If a black arrow  or empty black circle
  appears at the end of the connection in Path View maps, NNMi was not able to determine a status value because the connection or interface is not in the NNMi database. Click here for more information.
Reasons a connection or interface are not stored in the NNMi database, include the following:
- NNMi is unable to collect information about a node in the path because it is a non-SNMP node.
- A node in the path is not managed by NNMi.
- The discovery information for a node is not up-to-date (for example, interface information is missing).
Path View maps also show objects included in Layer 2 Neighbor View maps and Layer 3 Neighbor View maps. See "Help for Operators" for more information.
(NNMi Advanced) Path View works only with IPv4 addresses. The NNMi Advanced IPv6 address values are not valid choices for Path View. Any devices in your network that are configured with IPv6 addresses cannot be displayed on Path View maps.
(NNMi Advanced) If your network administrator configures NNMi to gather data from Router Redundancy Groups that have more than one Active router, NNMi selects one Active router for the path. To indicate there is more than one possible path, NNMi connects any additional routers to the Active router as shown in the example below:
(NNMi Advanced), plus Route Analytics Management System (RAMS) for MPLS WAN) If your network administrator configures NNMi to gather data from Route Analytics Management System (RAMS), the Path View can show multiple OSPFOpen Shortest Path First Protocol Equal Cost paths through a Layer 3 cloud as shown in the example below:
If you are an NNMi administrator, see RAMS MPLS WAN Configuration (NNMi Advanced) for information about configuring RAMS.
Navigate Maps
NNMi enables you to navigate within map views in the following ways:
- Change the Map Layout
- Toggle Map Object's Label Text
- Adjust the Zoom Factor
- Pan Around the Map
- Set the Location of the Overview Pane
- Select Options for Highlighting VLAN Members
- Highlight VLAN Members on Layer 2 Maps
- Find a Node in a Map
If you prefer a different layout for the symbols on your map, you can change the placement (see About Map Symbols):
To make quick changes:
n to toggle node labels on/off
p to toggle port labels on/off
To display the
Chassis icons associated with a device:Devices with more than one Chassis are indicated by the following icons:
Node Switch Switch-RouterClick
 to display the entire group of Chassis within a device. NNMi adjusts the layout of the entire map to make room for the expanded map icon. For example:
- Click the
 icon and drag to resize the expanded device icon.
 Click the
 icon to collapse the expanded device icon.
 To return the map to its prior layout, click the Workspace: View link for that map. NNMi draws a fresh rendering in the layout last
 Saved by an NNMi user (all NNMi users share the same version of the map).
To move a single object:
Left-click and drag any map symbol to the location you want on the map.
To deselect the object, either click on the map background or use Ctrl + Left-Click.
To move multiple objects:
Do any of the following:
Shift+Left-Click the mouse in an empty space between nodes and drag the cursor over the area of the map you want to select. When you use this method, NNMi indicates the selection area using a dotted line (or rubber band) as shown in the following example:

Use Ctrl+Left-Click to select or deselect each object of interest on the map.
Each object you select changes to indicate it has been selected. Drag any one of the selected nodes to move the group of objects to the location you want on the map.
If you drag using space between the nodes, all objects are deselected.
This placement persists until you refresh or otherwise reload the map.
Node Group Maps only: If your role permits, click the  Save Map toolbar button to keep the new layout visible on that map in the future. Once a map is saved, newly discovered devices appear in the bottom left corner of the map.
Each time you select Save Map, NNMi deletes any previous node location information for the map. All team members see the changes.
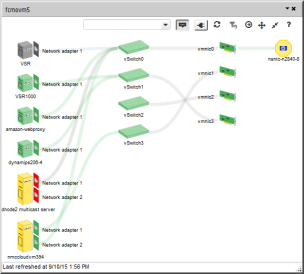
Virtual devices(NNMi Advanced):
| L2 Map | Wheel Dialog |
|---|---|
To display in formation about one Hypervisor's resources, right-click any object representing a hypervisor, virtual machine, or component of a hypervisor (such as Interface), and then select: Hypervisor > Hypervisor Wheel (Using the Wheel Dialog) Hypervisor > Hypervisor Loom (Using Loom Dialog) |
|

Toggle Map Object's Label Text
Press n to show/hide object names on the map.
Press p to show/hide Port names at the end of connection lines.
You can adjust the zoom factor in a map in several ways.
To zoom-in a map:
Do one of the following:
- Rotate the mouse wheel button forward.
- Click
 .
. Press + (PLUS SIGN).
In the Overview Pane, double-click the Focus Area that is indicated with the blue rectangle as shown in the following example:

If NNMi does not indicate a Focus Area, double-click anywhere in the Overview Pane.
The Overview Pane provides a view of the entire map you selected. The Focus Area indicates the portion of the map that NNMi displays in the larger map view.
To zoom-out a map:
Do one of the following:
- Rotate the mouse wheel button backward.
- Click
 .
. - Press - (minus sign).
In the Overview Pane, double-click outside the Focus Area that is indicated with the blue rectangle.
To fit the entire map to the screen size:
Do one of the following:
- Click
 .
. - Press = (equal sign).
- Click
To display the map at 100 percent (actual size device images):
Do one of the following:
- Click

Press 1 (ONE).
- Click
If the node of interest is not easily visible on the map, you can move to other sections of the map.
To pan to other sections of the map:
Do one of the following:
- Press the arrow keys to move the map around (↑ up arrow, ↓ down arrow, → right arrow, ← left arrow).
- Left-click the background and use the mouse to drag to a new location.
- Press Ctrl + Left-Click to pan around the map.
The Overview Pane provides a view of the entire map.
NNMi indicates the Focus Area using a light-blue rectangle as shown in the following example:
See Set the Location of the Overview Pane.
- Drag the Focus Area to pan around the map.
- Double click inside the Focus Area to zoom in.
- Double click outside the Focus Area to zoom out.
Set the Location of the Overview Pane
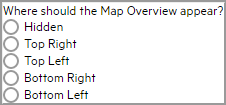
You can choose which corner of the map contains the Overview Pane:
Alternatively, you can hide the Overview Pane .
To set the location of the Overview Pane:
- In the Map toolbar, toggle the Overview Location button on:

- In the menu, select one of locations
- To close the menu, toggle the Overview Location button off:

Select Options for Highlighting VLAN Members
You can select the members of a discovered VLAN on a Layer 2 map. The  VLAN Highlight Options button helps you select three different options to highlight VLAN members.
To select highlight options:
- Toggle the VLAN Highlight Options button on.
- Select the following options based on your highlight preferences:
| Attribute | Description |
|---|---|
| Fade Non-Members | Select  this option to fade out nodes on the map that do not have ports as members of the current VLAN. this option to fade out nodes on the map that do not have ports as members of the current VLAN. |
| Emphasize Member Nodes | Select this option to encircle nodes that have ports as members of the current VLAN. |
| Emphasize Member Connections | Select this option to highlight Layer 2 connections between nodes that have ports as members of the current VLAN. |
Highlight VLAN Members on Layer 2 Maps
On a Layer 2 map, you can highlight the members of a specific VLAN.
To highlight the members of a VLAN:
- In the Map toolbar, toggle the
 Highlight VLAN Members button on.
 In the text box
 , do the following:
- Click the
 drop-down icon to display the complete list of VLANs discovered by NNMi for all the nodes on the map.
 Select a VLAN of your choice.
Alternatively, you can type the name of a VLAN (not case-sensitive) in the text box, and then press Enter.
As a result, all the members of the selected VLAN are highlighted on the map.
- Click the
You can easily find a particular Node in a map.
To find a Node in the current map:
- In the Map toolbar, toggle the Find button on:

In the text box
, do one of the following:- Click the drop-down icon to display the complete list of choices within this map. Select any item from the list.
Type the Name attribute value (not case-sensitive) of the Node you want to find in the map. This is the Name attribute value from the Node form, that becomes the map icon label.
As you type, the auto-complete feature displays a list of possible matches. Select any item from the list.
- Click the
- NNMi selects the Node that has a Name attribute value that matches your choice. If necessary, NNMi pans to the appropriate area in the Map.
- To navigate elsewhere in the map, toggle the Find button off:

Refresh Node Status on a Map
In map views, you can refresh the node status on a map while maintaining the layout of the nodes. This feature enables you to quickly refresh a view when you are only concerned with status updates for one or more nodes on your map.
NNMi automatically refreshes node status on a map every 60 seconds. The refresh counter begins after the completion of the last status refresh.
If a map is taking longer than expected to refresh, the maximum number of nodes that are displayed on a map might be set too high. The NNMi administrator can set this value. See "Help for Administrators" for more information.You can refresh the node status manually.
To refresh only the node status:
Click the  Refresh Status icon in the toolbar to manually refresh node status on your map view.
The last update time is changed and the status of each node is refreshed on the map. Nodes are not added, deleted, or rearranged. Connectivity is not recalculated.
Some NNMi users can delete nodes and other objects from the NNMi database (depending on the assigned NNMi Role). Any node that has been deleted appears as a transparent icon to all NNMi users until their map is refreshed using the Refresh icon. After Refresh, the deleted node is removed from the map. NNMi does not automatically refresh the connectivity or set of nodes in a map view, except on the Initial Discovery Progress and Network Overview maps.
Control Tool Tips Information on a Map
When you place the mouse cursor over an object on a map, NNMi displays Tool Tips information for the current object. Tool Tips information is a subset of the information contained in the object's form.
Each time you open a map, the  Tool Tips button is enabled.
To disable Tool Tips popups, click the  Tool Tips button. NNMi closes any open Tool Tip dialog boxes.
You can access maps in the following ways:
- From table views using the Actions menu
- From the
 Topology Maps and
  Troubleshooting workspaces
Table Views
To display a map view from a table view:
See Use Actions to Perform Tasks for more information about using the Actions menu.
- Select the table view you want from the workspaces navigation panel. (For example, select the Inventory workspace, Nodes view.)
- In the table view, click the row that contains the object of interest.
Select the Actions menu in the main toolbar and select the map view you want.

For VLANs, select the Actions menu, and then select VLAN Members View. This map displays all the nodes that are members of the selected VLAN.
You can also access map views from the Actions menu in a form. See About the NNMi Console, for more information.
You can also right-click any object in a table or map view to access the items available within the Actions menu.The label for the starting node appears in bold text on the map.
If you are displaying either Layer 2 or Layer 3 Neighbor View maps, after the map view appears, you can change the number of hopsA hop is a node representing any network device, such as a workstation, gateway, or switch, which is connected by a link with no intermediate nodes..
In the Number of Hops drop-down list, select the number of hops to display. The default number of hops is 1. The maximum number of hops is 9.
![]() Topology Maps Workspace
Topology Maps Workspace
To display a Node Group map:
- Select the Topology Maps workspace.
- Click
 to expand the folder of interest.
 - Select the name of the Node Group map you want to view.
![]() Troubleshooting Workspace
Troubleshooting Workspace
To display a Layer 2 or Layer 3 Neighbor View map:
- Select the Troubleshooting workspace.
- Select the type of map you want to generate.
In Layer 2 Neighbor View and Layer 3 Neighbor View maps, you can designate the starting node using either the node name or IP address. The label for the starting node appears in bold text on the map.
After you begin to type the node name or IP address, NNMi displays a list that includes all potential existing names or IP addresses that match the letters or numbers as you enter them.
After the map view appears, you can change the number of hopsA hop is a node representing any network device, such as a workstation, gateway, or switch, which is connected by a link with no intermediate nodes..
In the Number of Hops drop-down list, select the number of hops to display. The default number of hops is 1. The maximum number of hops is 9.
- Select the
To display a Path View:
- Select the Troubleshooting workspace.
- Select Path View.
In the Source and Destination fields, designate the nodes at both ends of the path using either the node name or IPv4 address.
After you begin to type the node name or IPv4 address, NNMi displays a list that includes all potential existing names or IPv4 addresses that match the letters or numbers as you enter them.
(NNMi Advanced) Path View works only with IPv4 addresses. The NNMi Advanced IPv6 address values are not valid choices for Path View. Any devices in your network that are configured with IPv6 addresses cannot be displayed on Path View maps.
- Select the
To display a Node Group map:
- Select the Troubleshooting workspace.
- Select Node Group Map.
In the Node Group field, specify the name of the Node Group that contains the nodes you want to display.
After you begin to type the Node Group name, NNMi displays a list that includes all potential existing names (case-sensitive) that match the letters or numbers as you enter them.
- Select the
Related Topics
Use Table Views
Status Color for Aggregator Objects ()
Status Color for Network Connections
Toggle Map Object's Label Text
Set the Location of the Overview Pane