


Monitor Incidents
The incidents are monitored to check if any changes occur. Different methods of monitoring incidents includes:
- Use a Dashboard View
- Use the Analysis Pane
- Verify Device Configuration Details
- View the Monitoring Settings Report
- Verify Current Status of a Device
Use a Dashboard View
To begin diagnosing a problem, you might want to view current information about the object.
NNMi includes dashboard views, which can contain multiple panels of data pertaining to the entire network, a specific object (for example, a node or interface), or a group of objects (such as a Node Group or Interface Group).
Dashboard views provide at-a-glance information, allowing you to easily compare and quickly isolate the information you need to analyze data and diagnose problems. Dashboard panels might contain a variety of tables and charts, some of which might are customizable.
There are two types of dashboard views:
Use the Analysis Pane
To begin diagnosing a problem, you might want to gather current information about the object.
The Analysis Pane displays related details about the selected object. NNMi performs the appropriate analysis on the selected object to determine the most important information to display. Any hyperlink within the Analysis Pane displays more information about the selected detail.
Examples of the types of related information includes details about an incident's Source Node and Source Object or information about a node's Interfaces and IP Addresses. See the Examples of Possible Analysis Pane Information table for more examples of the types of analysis data displayed.
-
-
Access the Analysis Pane from a table view:
- Select the workspace of interest (for example,
 Inventory).
 - Select the view that contains the object of interest (for example, the Nodes view).
- Select the row that contains the object of interest.
- NNMi displays detailed information at the bottom of the view in the Analysis Pane.
- Select the workspace of interest (for example,
-
Access the Analysis Pane in a map view:
- Select the workspace of interest (for example,
 Topology Maps).
 -
Select a map view (for example, select Routers).
If the map requires a starting node before it opens, enter the name or IP Address for the starting node you want to use.
- Click the map object of interest.
- NNMi displays detailed information at the bottom of the view in the Analysis Pane.
- Select the workspace of interest (for example,
-
Access the Analysis Pane in a form:
-
Click the form's toolbar
 Show Analysis icon to display information about the current form's top-level object in the Analysis Pane. Show Analysis always displays the top-level object's information.
 - Click a row in a table on one of the form's tabs to display detailed information about the selected object in the Analysis Pane.
NNMi displays detailed information at the bottom of the form in the Analysis Pane. See Working with Objects for more information about forms.
-
-
-
Open the Analysis Pane if necessary by clicking the
 expand button in the Analysis Pane banner bar:
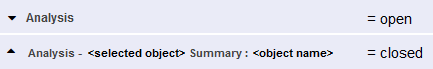
If you change views, NNMi clears the Analysis Pane. The Analysis Pane remains blank unless an object is selected.
If you select multiple objects, the Analysis Pane displays data about the first selected object.
-
Using the Analysis Pane:
- To resize, place your mouse cursor over the title bar to display the ↕ symbol and drag to adjust the size.
-
To refresh a subset of information in the Analysis Pane, click any displayed
 Refresh icon .
To refresh all data in the Analysis Pane, open the object's form and click
Refresh or  Save.
Save. - To launch an SNMP Line Graph for the selected metric, click the icon that appears at the bottom of each gauge.
- To select and copy the tooltip information, double-click the gauge. NNMi opens a text window that enables you to select and copy the tooltip information.
-
The Gauges tab shows real-time SNMP gauges to display State Poller and Custom Poller SNMP data.
- These gauges are displayed for Nodes, Interfaces, Custom Node Collections, and for Node Sensors of type CPU, Memory, or Buffers, and Physical Sensors of type Backplane.
-
NNMi displays a gauge for each significant MIB Object Identifier (OID) that the node or interface supports, up to the default maximum of 24.
-
Each gauge displays the current OID value, using the default refresh rate of 15 seconds.
- The value range displayed indicates the OID minimum and maximum values that NNMi has encountered.
- For any gauge that tracks percentage values, NNMi uses a red line to indicate where the OID value is near 100 percent.
-
There is not a one-to-one match between the OIDs used to analyze monitoring thresholds and those displayed in the Analysis Pane. For example, the Analysis Pane might display a Cisco Memory Pool OID value that does not match the value used to calculate whether the Memory Utilization Monitored Attribute threshold is reached or exceeded. This is because some threshold metrics require more complex calculations than a single OID allows.
If a gauge label appears to be a duplicate value, mouse over the label to view the more complete tooltip name that appears.
Some views are also accessible from the console's Actions menu. See Using Actions to Perform Tasks for more information.
Verify Device Configuration Details
Before you begin diagnosing a problem, you might want to gather current information about a node to update information in views and NNMi maps.
NNMi automatically gathers this information according to the Rediscovery Interval setting that was set by your administrator. The minimum allowed Rediscovery Interval setting is 1 hour. The default value set by NNMi is 24 hours.
To update the discovery information for a node:
-
Do one of the following:
Navigate to a table view and select a node
- From the workspace navigation panel, select the workspace of interest; for example, Inventory.
- Click the view that contains the node that has the configuration you want to check; for example Nodes.
- Select the row representing the node that has the configuration you want to check.
Navigate to a map view and select a node:
- From the workspace navigation panel, select the workspace of interest; for example, Topology Maps.
- Click the view that contains the node that has the configuration you want to check; for example Initial Discovery Progress or Network Overview.
- From the map view, click the node that has the configuration you want to check.
Navigate to a Node form:
- From a table view, double-click the row representing the node that has the configuration you want to see.
- From a map view, click the map icon for the node of interest and click the
 Open icon.
-
Select Actions → Polling → Configuration Poll.
You can also right-click any object in a table or map view to access the items available within the Actions menu.Each time you select Actions → Polling → Configuration Poll, NNMi also applies any Custom Poller Policy that is associated with the selected node. This determines which instances should be polled. See Configure Custom Polling for more information.
As the node is polled, NNMi displays the status messages for the Layer 3 discovery information. A Layer 2 connectivity analysis is also started. Information collected includes the node's IP address, subnet, contact name, location, and description.
View the Monitoring Settings Report
Use the Actions → Configuration Details → Monitoring Settings menu item to display the monitoring settings report for a particular object.
You can also right-click any object in a table or map view to access the items available within the Actions menu.NNMi can be configured to monitor several aspects of each device, and provide a wealth of information to help you do your job. After fault polling is enabled, several NNMi processes work together to detect problems and quickly calculate the device status and the root cause of any problems for you.
(NNMi Advanced) If the Global Network Management feature is enabled and you are signed into a Global Manager:
- Node managed by the Global Manager = Actions → Configuration Details → Monitoring Settings opens a report, provided by the Global Manager (NNMi management server).
Node managed by a Regional Manager = Actions → Configuration Details → Monitoring Settings accesses that Regional Manager (NNMi management server) and requests the report.
You must sign into that Regional Manager unless your network environment enables Single Sign-On (SSO) to that Regional Manager through the Global Manager.
(NNM iSPI Performance for Metrics) The Network Node Manager iSPI Performance for Metrics Software can monitor performance statistics and thresholds for each interface.
| Attribute | Description |
|---|---|
| Node Group | The name of any Node Groups to which this device belongs. See About Node and Interface Groups for more information. |
| Fault Polling (SNMP and ICMP) | If enabled, State Poller monitors all managed interfaces, IP addresses, and SNMP agents by issuing ICMP pings and SNMP read-only queries for MIB-II If disabled:
|
| Fault Polling Interval | The time that State Poller waits between issuing queries to gather fault information. The default Fault Polling Interval is 5 minutes, except for the Node Group named Microsoft Windows Systems which is 10 minutes. |
Requires Network Node Manager iSPI Performance for Metrics Software (NNM iSPI Performance for Metrics). To populate performance data in the dashboard views or enhance NNM iSPI Performance for Metrics reports by sharing NNMi configuration settings, install the optional Network Performance Server (NPS). | |
| Performance Polling | (NNM iSPI Performance for Metrics) If enabled, the Network Node Manager iSPI Performance for Metrics Software is installed. The NNM iSPI Performance for Metrics is accessed from the Action menu within map views and table views. If disabled, network performance data is not currently available. |
| Performance Polling Interval | (NNM iSPI Performance for Metrics) The time that the Network Node Manager iSPI Performance for Metrics Software waits between issuing queries to gather performance information. The default Performance Polling Interval is 5 minutes, except for the Node Group named Microsoft Windows Systems which is 10 minutes. |
To view the monitoring settings report for a Node (SNMP Agent), Interface, IP address, or Card:
- Navigate to the view for that object (for example, Inventory workspace, Nodes view).
- Select the row representing the object information.
Select Actions → Configuration Details → Monitoring Settings.
This menu item also is available on any object's form.
To view the monitoring configuration for a Router Redundancy Member:
- Navigate to a Router Redundancy Members view (for example, Inventory workspace, Router Redundancy Members view).
- Select the row representing the Router Redundancy Member of interest.
- Select Actions → Configuration Details → Monitoring Settings.
To view the monitoring configuration for a Tracked Object:
- Navigate to a Router Redundancy Group view (for example, Inventory workspace, Router Redundancy Groups view.
- Double-click the row representing the Router Redundancy Group of interest.
- From the Router Redundancy Members tab, double-click the row representing the Router Redundancy Group Member of interest.
- Select the Tracked Object of interest by selecting the row representing the object information.
- Select Actions → Configuration Details → Monitoring Settings.
To view the monitoring configuration for a Node Sensor:
- Navigate to a Node view (for example, Inventory workspace, Node Sensors view).
- Select the Node Sensor of interest by selecting the row representing the object information.
- Select Actions → Configuration Details → Monitoring Settings.
This menu item is also available on any
Node Sensorsform.
To view the monitoring configuration for a Physical Sensor:
- Navigate to a Node view (for example, Inventory workspace, Physical Sensors view).
- Select the Physical Sensor of interest by selecting the row representing the object information.
- Select Actions → Configuration Details → Monitoring Settings.
This menu item is also available on any Physical Sensors form.
Verify Current Status of a Device
NNMi calculates the status of devices each time additional information is gathered. You can instruct NNMi to gather real-time data for all the information that NNMi uses to calculate Status for each selected Node or selected Incident's Source Node (up to maximum 10).
Using Actions → Polling → Status Poll does not affect the timing of the Polling interval configured for the device.
You can also right-click any object in a table or map view to access the items available within the Actions menu.To update node status information:
Navigate to the view of interest and select each node that has the status information you want to update. Do one of the following:
Navigate to a table view and select up to 10 nodes:
- From the workspace navigation panel, select the workspace of interest; for example, Inventory.
- Click the view that contains the nodes that has the status you want to update; for example Nodes.
- From the table view, press Ctrl-Click to select each row that represents a node that has a status you want to update (maximum 10).
Navigate to a map view and select up to 10 nodes:
- Navigate to the Topology Maps workspace.
- Open the map view.
- Ctrl-click each node that has a status you want to update (maximum 10).
Navigate to an incident view and select up to 10 incidents:
- Navigate to the Incident Management or Incident Browsing workspace.
- From a table view, press Ctrl-Click to select each row that represents an incident that has the Source Node status you want to update (maximum 10).
- Select Actions → Polling → Status Poll.
A window for each Node displays with a report about which information was gathered. Your NNMi administrator determines the list of information gathered by establishing Monitoring Configuration settings.
Status Poll Data Returned Item Description Policy Describes the item being gathered. Target Identifies where the information is being gathered. Poller The name of the Polling Policy that NNMi State Poller uses to control what is gathered. The following additional information displays:
- If the target is responding.
- If the poll was successful.
- How long it took to get an answer.
Resulting Data Shows the results for this item.
To see the resulting Node status after the real-time update:
Do one of the following:
- Open the appropriate Node form, see Access Device Details. Check the information displayed on the Node Form: Status Tab and the Node Form: Node Sensors Tab.
- Check the Node icon status colors on maps (Watch Status Colors).
- In a Node view, locate the row representing the node and check the icon in the Status column.
- From the Incident form, open the Source Node's form, see Incident Form for instructions about using the Source Node attribute to open the appropriate Node form.
Related Topics: