


View the MPLS Topology Maps
With the NNM iSPI for MPLS, you can view the complete connectivity of the network by using the map views.
The NNM iSPI for MPLS presents map views that help you visualize your topology to view the network connectivity. This topic includes the following sections:
- TE Tunnel Path View
- MPLS L3 VPN Topology View
- MPLS Inter-Provider VPN Topology Map View
- MPLS L2 VPN Topology View
- MPLS Path View
- LSP Path View
- MPLS LDP Neighbors
- IP Multicast Map View
- IP Multicast Reverse Path View
- MPLS Map Symbols
The NNM iSPI for MPLS presents map views—MPLS Path view, MPLS is VPN Topology view, L3 VPN Topology View , L2 VPN Topology View, LSP Path View and MPLS TE Tunnel Path view. With the NNM iSPI for MPLS, you can view the graphical representation of your network connectivity by using the following actions:
The NNM iSPI for MPLS presents map views—MPLS Path view, MPLS is VPN Topology view, L3 VPN Topology View , L2 VPN Topology View, LSP Path View, MPLS TE Tunnel Path view and MPLS LDP Neighbors View—that help you construct, visualize, and troubleshoot the network. With the NNM iSPI for MPLS, you can view the graphical representation of your network connectivity by using the following actions:
- MPLS Path View
- MPLS L3 VPN Topology View
- MPLS LSP View
- MPLS TE Tunnel Path View
- MPLS LDP Neighbors
- MPLS L2 VPN Topology View
Use the map views for the following:
- MPLS Path view to monitor the MPLS-enabled nodes and MPLS objects . MPLS Path view shows an MPLS path map view from source to destination on the network. This action is available from the MPLS LSR view.
- MPLS L3 VPN Topology to monitor the PE-CE nodes and interfaces participating to form an L3 VPN. MPLS L3 VPN Topology view shows an MPLS L3 VPN map. The MPLS L3 VPN Topology Map view shows the VRFs participating to form an L3 VPN. This action is available from the MPLS L3 VPN view.
-
MPLS L2 VPN Topology to monitor PseudoWires or VFIs participating to form an L2 VPN. The MPLS L2 VPN Topology View shows an MPLS L2 VPN map. The MPLS L2 VPN Topology Map view shows the PseudoWires or VFIs participating to form an L2 VPN. This action is available from the VPLS/VPWS VPN view
- MPLS LSP View to monitor the Label Switched Path (LSP) path between the two VRFs or PseudoWire VC. MPLS LSP view shows one endpoint connected to another endpoint through an LSP. In this case, an endpoint can be an MPLS object like a VRF or a service like an Attachment Circuit (AC). This action is available from L3 VPN inventory, VPLS inventory, VPWS inventory, and PseudoWire VC inventory.
- MPLS TE Tunnel Path View to monitor the path of TE tunnels. MPLS TE Tunnel Map view shows the TE Tunnel Path from the source to the destination.The TE Tunnel Path view provides the real-time routing data flow path from source to destination. This action is available from the MPLS TE Tunnel view.
-
MPLS LDP Neighbors map helps you to view the LDP neighbors for the selected source node. The Label Distribution Protocol (LDP) also enables the MPLS nodes to exchange label information. The MPLS LDP neighbor map displays the immediate LDP neighbors of a selected node.
In addition, you can perform the following tasks:
- Troubleshoot and investigate the status change and loss of connectivity of the MPLS nodes or interfaces.
- Navigate to the node and interface inventory from the map views
-
Show Multicast Data Flow. This action displays a Multicast forwarding tree for the selected MDT. This action is available from the MDT form.
-
Show Multicast Reverse Path. This action displays the path that a packet takes from a receiver or the selected router to reach the source. The action is available from the MDT form.
-
Maintain QA probes for VRFs and displays QA probes graphs. This action is available from QA Probes tab and Analysis Pane of VRF Form.
You can access the map views from the Actions menu. Also, see MPLS Map Symbols to understand the topology views better.
TE Tunnel Path View
The MPLS TE Tunnel Path View shows a network path between a source and destination end point that forms a TE Tunnel. The map view shows the head router, tail router, intermediate routers, direction of the flow, and status of the nodes and interfaces participating in the TE Tunnel. The TE Tunnel map views shows all the Cisco, Juniper, and Alcatel routers configured with TE Tunnel. The TE Tunnel path is the dynamic traffic flow path where the hops are updated periodically.
On the TE Tunnel maps, the nodes and interfaces are represented as symbols on the map. The lines between nodes indicate the connections. For each status color for a node, interface, or IP address that might appear on a map, see NNMi Help, Understand Maps.
Use the TE Tunnel path view to perform the following tasks:
- Find and view the nodes and interfaces participating to form a TE tunnel path.
- Determine the head, tail and intermediate routers of the TE Tunnel.
To launch a TE Tunnel Path view:
- From the Workspaces navigation pane, click MPLS-> TE Tunnel Inventory. The MPLS TE Tunnel view opens in the right pane.
- In the TE Tunnel Inventory, select a TE Tunnel.
- From the menu bar, select Actions-> MPLS TE Tunnel Path view. The TE Tunnel path opens in a new window.
- Click the Status Refresh icon to update the status of the MPLS objects. Click
 (the Refresh icon) to update the map view.
To launch a TE Tunnel Path view from the TE Tunnel Form view:
- From the Workspaces navigation pane, click MPLS-> TE Tunnel Inventory. The MPLS TE Tunnel view opens in the right pane.
- To open the TE Tunnel form, click
 (the Open icon).
 - From the menu bar, select Actions-> MPLS TE Tunnel Path View. The TE Tunnel path opens in a new window.
Example of the TE Tunnel Path View:
In this example, the TE Tunnel starts from the head node ciscope6524 to the tail node ciscope3745. The intermediate routers are Juniper and Cisco routers. Double-click the node to open the node form. Double-click the square boxes attached to the node to open the interface form. The marked outgoing interface of the junoscore6350 is Unknown. For more information about the node symbols, icons, and status color, see MPLS Map Symbols.
The path between the selected source and destination node may go down or reroute. If you want to view the earlier path between the selected node, the map provides a Show previous path option. To view the previous path:
- Launch the TE Tunnel path view.
- Select 'Yes' from the Show previous path drop-down in the upper right corner of the window.
Troubleshoot the network connectivity from the TE Tunnel Path View:
- Navigate to the MPLS TE Tunnel Path view.
- To open the node or interface, use any one of the following:
- Double-click the node or interface.
- Select the node, click (the Open icon).
- From the TE Tunnel form, click the Incidents tab to view the incident.
MPLS L3 VPN Topology View
You can troubleshoot the faults associated in your L3 VPN topology by using the MPLS L3 VPN map view. This map view is a service-centric map view. You can monitor the status of the CE nodes, interfaces, VRFs, and PE nodes participating to form an L3 VPN.
In an MPLS L3 VPN topology map view, VRFs, VPNs, CE nodes, and PE nodes are represented as symbols on the map. The lines between the MPLS objects such as VRFs indicate the communication connections. For each status color for a VRF, interface, or IP address that might appear on a map, see MPLS Map Symbols and NNMi Help, Maps Symbols.
Use this view to perform the following tasks:
- Find the VRFs participating to form an L3 VPN.
- Find the CE nodes and interfaces in the L3 VPN. For more information, see L3 VPN Map Toolbar.
- Find out the PE-CE link connectivity for the selected L3 VPN.
- Determine the status of the VRFs residing on the PE node connected to the CE node.
- Troubleshoot the root cause of the L3 VPN status. Navigate to the MPLS object form and view the incidents tab.
- Check the status of all the VRFs that participates to form an L3 VPN.
- Check the status of the PE and CE interface and PE and CE node.
- View Inter-Provider VPNs with AS#s of other ISPs .
To launch an MPLS L3 VPN view:
- From the Workspaces navigation pane, click MPLS-> L3 VPN Inventory. The MPLS L3 VPN view opens in the right pane.
- In the MPLS L3 VPN view, select a row representing the required L3 VPN.
- Click Actions-> MPLS L3 VPN Topology View The L3 VPN graph opens in a new window.
- Click
 (the Compute Map icon) to display the updated map, Click
  (the Refresh Status icon) to update the status of MPLS objects. Click
  (the Refresh icon) to update the map view.
The MPLS L3 VPN maps show the near real-time status of all the VRFs participating in the selected L3 VPNs. The following types of L3 VPN topologies are shown in the map view:
- Full-Mesh
- Other
- Isolated
- Hub and Spoke
Start the following from an MPLS L3 VPN map view:
- Double-click the VRF icon to open the VRF form. To troubleshoot the loss of connectivity, check the status or incidents associated with the selected VPN or the VRFs participating to form an L3 VPN.
- Double-click the CE node to open the CE node form.
- Double-click the CE interface to open the CE interface form.
- Show all the CE nodes in the selected L3 VPN topology.
- Show all the CE nodes for the selected VRF.
- Find the type of PE-CE link connectivity on the network.
Examples of the MPLS L3 VPN map view
 | This is an example of a Full Mesh L3 VPN. Double-click the VRF icon to open the VRF form. |
 | This is an example of a Hub and Spoke L3 VPN. All the VRFs are communicating with the Hub VRF. Double-click the Hub VRF icon to open the Hub VRF form. |
This is an example of a Full Mesh L3 VPN.
Troubleshoot the network connectivity from the MPLS L3 VPN View:
- Navigate to the MPLS L3 VPN view.
- To open the node or interface, use any one of the following:
- Double-click the VRF or CE node.
- Select the VRF and click
 (the Open icon).
- From the VRF or L3 VPN form, click the Incidents tab to view the incident.
Use the L3 VPN Map View Toolbar
The NNM iSPI for MPLS provides the L3 VPN map view toolbar to help you customize your map views.

The L3 VPN Map view toolbar lets you customize your map views for the following tasks:
- Shows the CE nodes and interfaces on the L3 VPN map view.
- Shows the CE nodes associated with the selected VRF and Node Group Name.
The MPLS L3 VPN map view appears with the VRFs and VRf Lites participating in the L3 VPN. The map view toolbar contains the NNMi icons such as Open, Refresh, Refresh, and Status. The following table lists the MPLS icons.
| Icon | Description |
|---|---|
| Show CEs | Select the option Yes or No to display the CE nodes on the MPLS L3 VPN map view. |
| NodeGroup Name | Type the Node Group Name. The CE nodes associated with the selected Node Group appears in the map view. As you type, the NNM iSPI for MPLS provides a selection list of all current valid entries matching your criteria. You must use one of the suggested values. The Node Group name helps you customize your map views. This field is applicable only if you have selected 'Yes' for show CEs. |
| VRF Name | Type the VRF Name. The CE nodes associated with the selected VRF name appears in the map view. This field is applicable only if you have selected 'Yes' for show CEs. |
To view the CE nodes available in the map view:
- Select the option Yes from the Show CEs list.This will display all the CEs participating to form the selected L3 VPN. You can filter these CEs based the host node.
- Type the NodeGroup Name. The CE nodes participating in the selected NodeGroup appears. Type the VRF Name. The CE nodes associated with the VRF Name appears in the map view. If you provide both the options such as VRF Name and Node Group Name, the map view shows the CE nodes passing through the Node Group or VRF or both. If the conditions such as VRF Name and Node Name do not match the requirement, the map view shows the appropriate messages.
Type a VRF Name in the filter as following: VRFName@nodename.For example, if you are searching for a VRF named test on a Cisco device, then you will search it as 'test@cisco'.
MPLS Inter-Provider VPN Topology Map View
Inter-Provider VPN is an extended feature for L3 VPN. You can view and troubleshoot the faults associated to your MPLS Inter-Provider VPN topology by using the MPLS L3 VPN map view. This map view is a service-centric map view. You can monitor the status of the CE nodes, interfaces, VRFs, PE nodes, PE-CE connectivity, and AS names or numbers of the third-party carrier service provider network participating to form an Inter-Provider VPN.
Use the Inter-Provider VPN Topology Map view to perform the following tasks:
- Find the VRFs participating to form an Inter-Provider VPN.
- Find the CE nodes and interfaces participating in the Inter-Provider VPN. For more information, see L3 VPN Map Toolbar.
- Discover the CE nodes residing in the remote client site.
- The third-party VPN clouds participating in the Inter-Provider VPN.
- As path followed by the PE-CE connectivity.
You can perform tasks such as launching and troubleshooting for MPLS objects participating in an Inter-Provider VPN. For more details, see To launch an MPLS L3 VPN view and Troubleshooting the network connectivity from the MPLS L3 VPN View in the MPLS L3 VPN Topology Map View.
PE-CE connectivity may show incorrect information if the CE is not configured properly. For example, a CE may be shown connected to a Cisco router instead of a Juniper router. In such cases, reconfiguring the CE will solve the problem.
MPLS L2 VPN Topology View
You can troubleshoot the faults associated in L2 VPN topology by using the MPLS L2 VPN map view. This map view is a service-centric map view. You can monitor the Attachment Circuits (ACs), status of service-centric objects associated with a VPLS or a VPWS, and status of Pseudo Wires participating to form an L2 VPN.
In an MPLS L2 VPN topology map view, ACs, service-centric objects, and Pseudo Wires are represented as symbols on the map. Status of each service-centric object is represented by a color, for more information on each status color, see MPLS Map Symbols and NNMi Help, Maps Symbols.
Use this view to perform the following tasks:
- Monitor status of service-centric objects associated with a VPLS/ VPWS. Status of service-centric objects is calculated based on most critical status of the ACs
- Monitor status of PseudoWires associated with a VPLS/ VPWS
- Launch LSP path view by selecting service centric object or PseudoWire in VPLS/VPWS map
- Monitor group of PseudoWires. This group is represented by a thick line. This group of PseudoWires is formed in the following two scenarios:
- Full-mesh VPLS topology, where all participant service centric objects are connected with each other.
- For a VPWS, where there are multiple PseudoWire connections between two service centric objects
Status of this thick line is calculated based on most critical status of PseudoWiresFor example, in a group of five pseudowires, even if one is critical, the entire group will have status as critical. participating to form the group. In addition, you can click the group of PseudoWires to get detailed information about each PseudoWire. This information is shown in the Analysis Pane
To launch an MPLS L2 VPN view:
These are steps to launch VPLS VPN topology view. You can follow the same steps to launch VPWS VPN topology view.
- From the Workspaces navigation pane, click MPLS-> VPLS VPN Inventory.
- Click and select a row representing the required L2 VPN.
- Click Actions-> MPLS L2 VPN Topology View The L2 VPN topology view opens in a new window.
- Click
 (the Compute Map icon) to display the updated map, Click (the Refresh Status icon) to update the status of MPLS objects. Click (the Refresh icon) to update the map topology and status.
Example of an L2 VPN Map
This is an example of VPWS topology.
To launch an LSP path:
VPLS Map:
- Launch VPLS map
- Select a PseudoWire
- Select LSP Path View tab from the Analysis Pane
- Click Launch LSP Path View. The LSP Path View shows a one-way path between the source and the destination. For a full-mesh VPLS, you have to select a PseudoWire from the Analysis Pane and then launch LSP Path View from the same table.
VPWS Map
- Launch VPWS map
- Select a PseudoWire
For a group of PseudoWires,select a PseudoWire from the Analysis Pane by clicking the PseudoWire Id. This action opens the PseudoWire VC form for the selected PseudoWire
- Select LSP Path View tab from the Analysis Pane
- Click Launch LSP Path View. The LSP Path View shows a one-way path between the source and the destination.
Analysis Pane for L2 VPN topology view shows details about the objects participating in a VPLS or VPWS topology respectively.
For service-centric object:
When you click on a service centric object in a VPLS or VPWS map, you will see the name of the object and of the node it is hosted to the left, under Summary.
To the right the following information is shown:
- PseudowireVCStatusPie chart - Shows Pie Chart that represents the status of all thePseudoWires
- SDPBindsStatusPie Chart - Shows Pie Chart that represents the status of all the SDPBinds.
VFI Neighbours - Shows the status of all the VFI Neighbors participating to form the selected VPLS VPN
Under PseudoWires, following information is shown:
- PseudoWire Id : This is the ID of the corresponding PseudoWire. Click on this ID to open the PseudoWire VC form. In case of group of PseudoWires, a list of all the PseudoWires that are a part of the group is shown.
- Status: Status of the selected PseudoWire. In case of a group of PseudoWires, this status will correspond to the most critical status of PseudoWires.
- AC1: Attachment Circuit corresponding to PE1
PE1: Source Provider Edge corresponding to the selected PseudoWire
- AC2: Attachment Circuit corresponding to PE2
- PE2: Destination Provider Edge corresponding to the selected PseudoWire
- LSP Path View - Shows a link to Launch LSP Path View. Click the link to launch a LSP path.
For PseudoWire:
When you click on a single PseudoWire corresponding to a VPLS or VPWS, you will see the following information:
- PseudoWire VC Summary. Shows the following details:
- Create Time
- Status
- Custom Attributes
- Management Type
- Management Mode
- PE1 - Source provider edge.
- PE2 - Destination provider edge devices
- VCLspStatusPieChart Tab- Shows Pie Chart that represents the status of all the VC LSPs participating to form the PsuedoWire
- LSP Path View Tab - Shows a link to Launch LSP Path View. You can click on this link to launch an LSP path.
In addition, if you click on a group of PseudoWires, you will see the following information:
- PseudoWires Summary : Name of the Source and destination sites corresponding the selected PseudoWire.
- Grouped PseudoWire details: Shows a table that lists all the individual PseudoWires that form the selected group. You can see the following information in the table:
- PseudoWire Id - This is the Id number of the selected PseudoWire. Click on it to open the PseudoWire VC form.
- Status - Status of the selected individual PseudoWire status.
- PE1 - Source Provider Edge corresponding to the selected PseudoWire
- AC1 - Attachment Circuit associated with PE1.
- PE2 - Destination Provider Edge corresponding to the selected PseudoWire.
- AC2 - Attachment Circuit associated with PE2.
- URL for LSP Path View - Shows a link to Launch LSP Path View. You can click on this link to launch an LSP path
To the right, for PseudoWireto AC Mapping the following information is shown:
- PseudoWire Id : This is the ID of the corresponding PseudoWire. Click on this ID to open the PseudoWire VC form. In case of group of PseudoWires, a list of all the PseudoWires that are a part of the group is shown.
- Status: Status of the selected PseudoWire. In case of a group of PseudoWires, this status will correspond to the most critical status of PseudoWires.
- AC1: Attachment Circuit corresponding to PE1
- AC2: Attachment Circuit corresponding to PE2
MPLS Path View
The MPLS Path view shows the Label Switched Path (LSP) between two nodes. View the states and status of Provider Edge (PE) and Provider nodes participating in the LSR path in the MPLS cloud.
You can view the most accurate MPLS path known as the best effort path only for Cisco nodes. The NNM iSPI for MPLS supports only OSPFOpen Shortest Path First protocols for the path calculation. When the NNM iSPI for MPLS is integrated with RAMS, you can view the complete path. For more information, see NNMi Help.
Use this view to perform the following tasks:
- Find the MPLS Label Switched Path (LSP) between two LSR nodes.
- Troubleshoot the connectivity problems in the path view.
To launch an MPLS Path view from the MPLS LSR view:
- From the Workspaces navigation pane, click MPLS-> LSR Inventory. The MPLS LSR View opens in the right pane.
- In the MPLS LSR view, select a LSR node
- From the menu bar, select Actions-> MPLS Path View. The MPLS Path View opens.
- Click (the Refresh Status icon) to update the status of the MPLS objects. Click (the Refresh icon) to update the map view.
The MPLS path view contains the following information:
- Node name and status
- Interface name and status
- Quick View
- Last update time and date
Example of the MPLS Path View:
The MPLS Path view shows the path from the node ciscope2691 to the node cicsocore6524. Double-click the square boxes attached to the MPLS node or switch to open the interface form. Alternatively, you can view the details from the Quick View window.
For more information about the node symbols, icons, and status color, see NNMi Map Symbols.
Troubleshoot the network connectivity from the MPLS Path View:
- Navigate to the MPLS Path view.
- To open the node or interface, use any one of the following:
- Double-click the node or interface which is displayed in the Inventory view on the right panel.
- Select the node, click (the Open icon).
- Navigate to the Incidents tab to view the incident and troubleshoot the cause of loss of network connectivity.
To find details of the TE tunnels, VRFs or PseudoWires VCs configured on the selected node from the MPLS Path view:
- Navigate to the MPLS Path view.
- To open the node form, use any one of the following:
- Double-click the node to view the node details such as VRF Tab, TE Tunnel Tab, and so on.
- Select the node, click (the Open icon).
- Click the <MPLS object>Tab from the selected Node form to view details of the MPLS objects such as TE Tunnel or VRF.
LSP Path View
LSP Path View shows the Label Switched Path (LSP) between two service centric objects.
From L3 VPN Inventory
You can launch an LSP path view between any two devices from the LSR inventory. To launch an LSP path view:
- Click L3 VPN Inventory from the MPLS workspace .
Select an L3 VPN and open the L3 VPN form
- Click
 , available under the VRF tab, to open all the VRFs of the L3 VPN in a new window.
 - Select two VRFs to determine which LSP you want to monitor
- Click Actions
- Click Monitor LSP
Similarly, from the L3 VPN topology view you can monitor LSP:
- Launch L3 VPN topology view
- Select two VRFs to determine which LSP you want to monitor
- Click Actions
- Click Monitor LSP
From VPLS Inventory
- Launch VPLS map
- Select a PseudoWire
- Select LSP Path View tab from the Analysis Pane
- Click Launch LSP Path View. The LSP Path View shows a one-way path between the source and the destination.
Note: For a full-mesh VPLS, you have to select a PseudoWire from the Analysis Pane and then launch LSP Path View from the same table.
From VPWS Inventory
- Launch VPWS map
- Select a PseudoWire For a group of PseudoWires,select a PseudoWire from the Analysis Pane by clicking the PseudoWire Id. This action opens the PseudoWire VC form for the selected PseudoWire
- Select LSP Path View tab from the Analysis Pane
- Click Launch LSP Path View. The LSP Path View shows a one-way path between the source and the destination.
From PseudoWire VC Inventory
- From the Workspaces navigation pane, click MPLS->PseudoWire VC Inventory.
- Select a PseudoWire from the PseudoWire VC Inventory view for which you want to launch a path view.
- Select LSP Path View tab from the Analysis Pane.
In addition, from the MPLS LSP Path View window, you can reverse the direction of the LSP path. Follow these steps to reverse the LSP path:
- Launch LSP path view
- To reverse the path select any service centric object or PseudoWire.
- Select 'Yes' from the Show Reverse LSP drop-down in the upper right corner of the window.
- Click (the Compute Path icon) to get the reversed path.
- To see the original direction of the path, click (the Compute Path icon) again.
VRF-LSP Service Map
You can launch MPLS LSP path view by selecting two neighboring VRFs participating to form the selected L3 VPN. Follow these steps to launch an MPLS LSP path view:
- Launch an L3 VPN map view from the L3 VPN Inventory.
- Select two neighboring VRFs participating in that L3 VPN by clicking on the VRF icons
The first VRF selected represents the source LSR and the second VRF represents the destination LSR. You can reverse source and destination by reversing the order of selection
- Click Actions and select MPLS Lsp Path View. This will launch the LSP path view between these VRFs in a different browser window.
MPLS LSP Path View shows the source LSR and destination LSR connected by a cloud when:
- Source and destination LSRs are not mapped to the services
- No Path exists between the source and destination
A path between two selected VRFs can pass through an LSP or a TE tunnel. TE tunnels are represented by the TE Tunnel icon. In addition, the map provides a Show Nodes for Tunnel option that expands the tunnel icon to display the Tunnel path. To expand, select 'Yes' from the Show Nodes for Tunnel list. Click
( the Compute Path icon) to get the Tunnel path. For more information, see Map Symbols.Also, the map provides a Show previous path option that displays the previous path between the selected source and destination node. To view the previous path, select Yes from the Show previous path list. Click
(the Compute Path icon) and then, you can view the previous LSP between the selected source and destination node for the VRF service.MPLS LDP Neighbors
With the MPLS LDP Neighbors map, you can view the LDP Neighbors within an MPLS network. Label Distribution Protocol (LDP) enables MPLS nodes to exchange label information. Any two routers that have an active LDP session between them are called peers or neighbors.
To Launch MPLS LDP Neighbors:
- Open LSR Inventory
- Click the MPLS workspace
- Click LSR Inventory
- Select the LSR for which you want to launch the map.
- Click Actions
- Click MPLS LDP Neighbors.
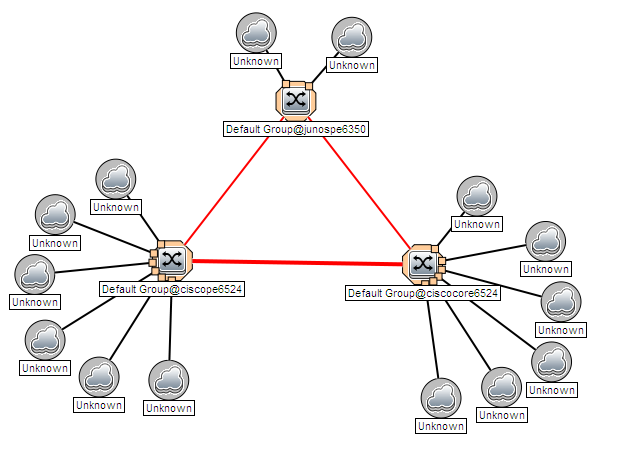
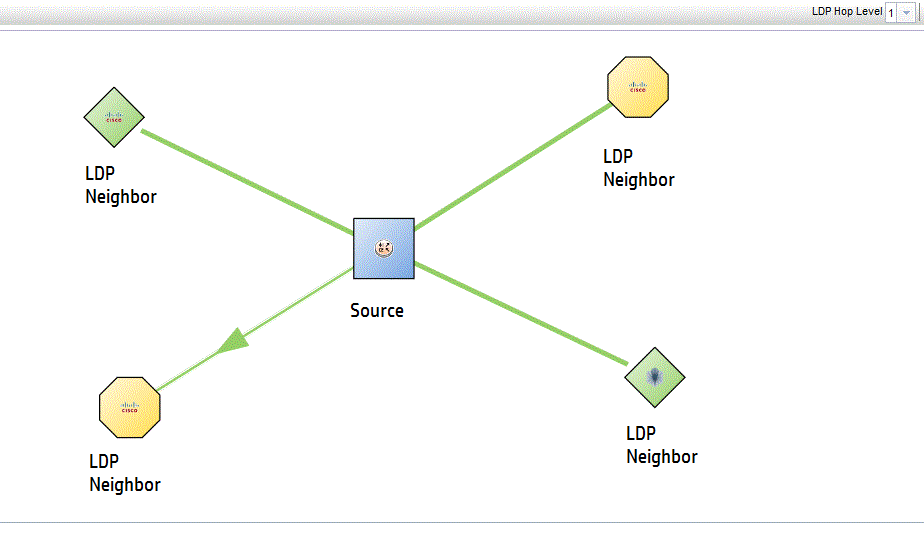
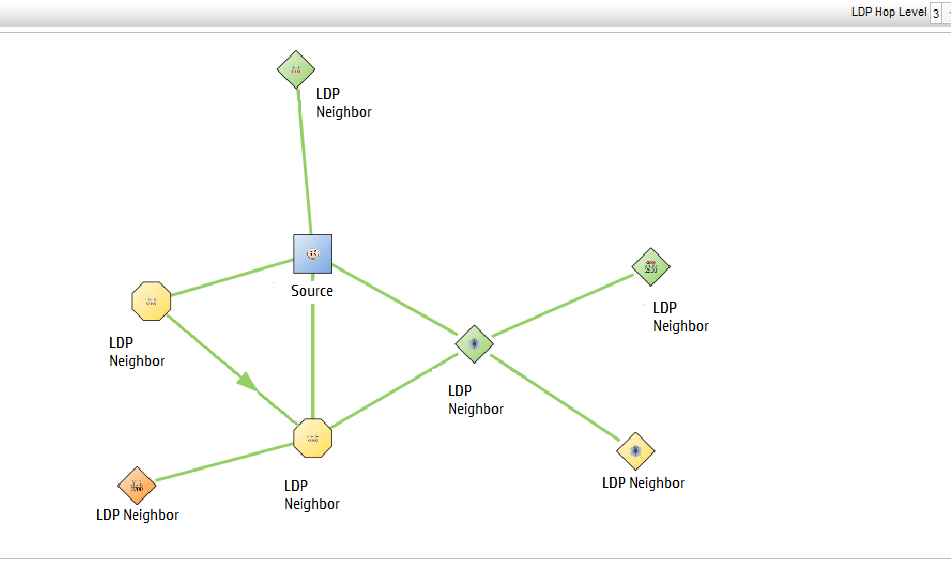
The MPLS LDP Neighbors map shows the LDP neighbors of a selected source node. Proximity of an LDP neighbor is based on the number of hops between the LDP neighbor and the source node and is indicated by the Hop Level. By default, the map displays the immediate LDP neighbors of a selected node that is Hop Level 1. You can change the hop level by using the LDP Hop Level list on the top right of the screen.
Example of MPLS LDP Neighbors map with LDP Hop Level 1
Example of MPLS LDP Neighbors map with LDP Hop Level 3
IP Multicast Map View
The IP Multicast map view shows the actual multicast path taken by the data packets over the MPLS cloud. Launch the IP Multicast Map view to troubleshoot the problems in your network.
Use the map view to perform the following tasks:
- Find the IP Multicast traffic flow in the downstream direction.
- Monitor the multicast traffic flow rate.
- Monitor the tree used by the packet to reach the receiver.
The URL action to launch the IP Multicast map view only appears after you install the iSPI for IP Multicast and verify that all NNMi and IP Multicast processes are running. For more information, see the iSPI for IP Multicast Installation Guide and Online Help.
To launch the iSPI for IP Multicast map view:
- Navigate to the MVPN form
- From the Workspaces navigation pane, click MPLS-> MVPN Inventory. The MVPN Inventory view opens in the right pane.
- Click (the Open icon) to view the MVPN form.
- From the MVPN form, select theMDTs Tab.
- Click (the Open icon) to view the MDT form. From MDT form, select the Data MDT.
- Click Actions-> Show the Multicast Flow. The IP Multicast map view appears and starts from the selected source.
- Click (the Refresh icon) to update the map view. Click
 (the Refresh Status icon) to update the status of MPLS objects.
To launch the iSPI for IP Multicast map view from the VRF form:
- Navigate to the MVRF Form
- From the Workspaces navigation pane, click MPLS-> MPLS L3 VPN Inventory. The L3 VPN Inventory view opens in the right pane. Select the MVPN tab.
- Click (the Open icon) to view the MVRF form.
- From the MVRF form, select the Downstream MDTs Tab. Select the Data MDT. Do not select the Default MDT.
- Click Actions-> Show the Multicast Flow. The IP Multicast map view appears and starts from the selected source.
- Click (the Refresh icon) to update the map view. Click (the Status Refresh icon) to update the status of MPLS objects.
IP Multicast Reverse Path View
The reverse path view shows the multicast routing path from a receiver router to the source router.
The URL action to launch the IP Multicast Reverse Path view only appears after you install the iSPI for IP Multicast and verify that all NNMi and IP Multicast processes are running. For more information, see the iSPI for IP Multicast Installation Guide and Online Help.
To launch the iSPI for IP Multicast reverse path view:
- Navigate to the MVRF Form
- From the Workspaces navigation pane, click MPLS-> MPLS L3 VPN Inventory. Alternatively, from the Workspaces navigation pane, click MPLS-> MVPN Inventory. The L3 VPN Inventory view opens in the right pane. Select the MVPN tab.
- Click (the Open icon) to view the MVRF form.
- From the MVRF form, select the Downstream MDTs Tab. Select the Data MDT. Do not select the Default MDT.
- Click the URL for Multicast Reverse Path View from the Analysis Pane
- Click (the Refresh icon) to update the reverse path view.
Example of a IP Multicast Reverse Path View
MPLS Map Symbols
(See, About Map Symbols and About Status Colors in NNM Online Help: Console Help before you begin with this topic)
The map views provide you with the graphical representation of the MPLS objects participating on the network. Map symbols are used to represent nodes, interfaces, and MPLS objects such as VRFs, VRF Lites, MVRFs, Hub VRF, and Hub MVRFs, The lines between the nodes and interfaces represent the connection or relationship between these objects.
The NNM iSPI for MPLS uses NNMi shapes for the nodes and interfaces. The NNM iSPI for MPLS uses the same symbols to represent both, a VRF or a VRF-Lite on the map. The NNM iSPI for MPLS uses the NNMi status colors to represent the status of the MPLS object. For more information, see NNMi Help, About Status Colors. The icons used to show the MPLS objects are as follows:
Icons Used By MPLS Icons Meaning 
Used in maps to represent a VRF. 
Used in maps to represent a Hub VRF. 
Used in maps to represent a VRF-Lite. 
Used in maps to represent an MVRF. 
Used in maps to represent a Hub MVRF. 
Used in map view to represent a CE node. 
Used in L3 VPN to show:
- A full mesh L3 VPN topology on the network.
- A PE interface connected to an unknown CE interface. The CE interface on the node is indicated on the map by a cloud symbol.
- Multiple PE interfaces connected to one CE interface. This path is detected by the Hot Standby Router Protocol (HSRP) link connectivity. This HSRP connection is indicated on the map by a cloud symbol.
- Multiple CE interfaces connected to one PE interface. This path is connected by a switch. This is indicated on the map by a cloud symbol.
Used in Inter-provider VPN to show:
- Third-party VPN clouds participating in the Inter-Provider VPN
Used in L2 VPN to show:
- A full mesh L2 VPN on the network
- A service object connected to an unknown CE interface. The CE interface on the node is indicated on the map by a cloud symbol.

Represents the service centric object associated with a VPLS. For example, VPLS_<vc id>@hostname 
Represents the service centric object associated with a VPWS. <vpws_groupname>@<hostname> 
Connector that represents a CE-VRF-Lite or PE-VRF-Lite connection. 
Represents a Pseudo Wire. The color of the selected Pseudo Wire is the status color. 
Represents collective Pseudo Wires grouped as one. You can click this symbol to view individual Pseudo Wires in the Analysis Pane. The color of the selected Pseudo Wire is the status color. 
Represents TE Tunnel. Shapes Used By MPLS Icons Meaning 
Used to show the Full Mesh L3 VPN. This shape is superimposed with the cloud icon. 
Used to show an unknown CE node. When the shape is superimposed with the cloud icon, it represents the following:
- A PE interface connected to an unknown CE interface. The CE interface on the node is indicated on the map by a cloud symbol.
- Multiple PE interfaces connected to one CE interface. This path is detected by the Hot Standby Router Protocol (HSRP) link connectivity. This HSRP connection is indicated on the map by a cloud symbol.
- Multiple CE interfaces connected to one PE interface. This path is connected by a switch. This is indicated on the map by a cloud symbol.

Used to represent a VRF. In a map view, this symbol is superimposed with the 'VRF' or 'VRF Lite' symbol. The color of the selected VRF is the status color. 
Used to represent a switch. The color of the selected switch is the status color. 
Used to represent third-party VPN provider in an Inter-Provider VPN network. This shape is superimposed with the cloud icon.