


Monitor with Graphs
The NNMi Actions menu enables you to view real-time SNMP data for selected nodes or interfaces. This feature is useful when you want to use a Line Graph to monitor a numeric MIB Expression value for a node or interface over a specified time interval. For example, you might want to view a Line Graph of the network traffic using the ifOutOctets (Interface Out Octets) MIB variable for a specified node. Or you might want to graph a MIB variable, such as ifInOctets (Interface In Octets), to verify that a problem has been fixed for a specified interface before closing an incident.
The node for which you want to view information must support SNMPv1, SNMPv2c, or SNMPv3.
You can also right-click any object in a table or map view to access the items available within the Actions menu.NNMi provides a set of Line Graphs for nodes and for interfaces.
- Select the Graphic Tool
- Change the Polling Interval for a Graph
- Select a Time Segment Using the Timeline Viewer or Focus Chart
- Unlock the Y-Axis When Viewing a Time Segment
- Switch the Y-Axis Scale for a Graph
- Change the Zoom Value for a Graph
- Display Data Values on a Graph
- Determine the Maximum Time Range for a Graph
- Print a Graph
- Export Graph Data to a Comma-Separated Values (CSV) File
Your NNMi administrator might configure additional Line Graphs.
To access a Line Graph from a table view:
- Navigate to the view for that object (for example, Inventory workspace, Nodes view).
- Select the nodes or interfaces of interest by pressing Ctrl-Click to select the rows representing the object information.
Select Actions → Graphs → <graph_submenu> → <graph_name>
This menu item also is available on any supported object's form.
To access a Line Graph from a map:
- Navigate to the map of interest (for example, Topology Maps workspace, Initial Discovery Progress or Network Overview map).
Click the object or objects that have the data you want to graph. Use Ctrl-Click to select multiple objects.
- Select Actions → Graphs → <graph_submenu> → <graph_name>
Your NNMi client displays the corresponding Line Graph and continues to request new values until you close the Line Graph window.
To access a Stacked Area Graph from a table view:
- Navigate to the view for that object (for example, Inventory workspace, Nodes view).
- Select the nodes or interfaces of interest by pressing Ctrl-Click to select the rows representing the object information.
Select Tools → Status Distribution Graphs.
Select the Graphic Tool
NNMi provides Line Graphs using HTML5 and Flash-based tools. You can select your preference from the View menu.
To select the graphic tool to view Line Graphs:
- To view Line Graphs using Flash-based tools, select View → Use the Flash-Based Real Time Graph.
- To view Line Graphs using HTML5-based tools, select View → Use the Non-Flash Based Real Time Graph.
Once you make a selection, NNMi saves the Graphic tool selection you make.
The Non-Flash based real time graph is the recommended tool to generate Line Graphs. The Line Graphs will appear different when generated using Flash-based tools.
Flash-Based Real Time Graph
The Flash-based real time graph is generated using the Flash browser plugin.
Non-Flash Based Real Time Graph
The Non-Flash based real time graph is generated using HTML5 and is the recommended tool to generate Line Graphs.
The Polling Interval determines how often NNMi requests for the data point sets displayed in a graph. When you change the Polling Interval in a graph, you are temporarily changing the Polling Interval for graphing purposes only.
By default, NNMi uses 15 seconds, or a value specified by the NNMi administrator or Network Node Manager i Software Smart Plug-in.
The NNMi administrator or Network Node Manager i Software Smart Plug-in specifies the Maximum Time Range in which to retain the graph's data point sets. After the Maximum Time Range number is reached, NNMi begins to discard the oldest data point sets so that it can display the most recent data for the time range specified. For example, if the Maximum Time Range is 24 hours, when 24 hours has passed, NNMi removes data starting with the initial data point set so that it can display data for the most recent 24-hour interval. NNMi displays a Warning message if it is unable to graph the data for the Maximum Time Range specified. You can lengthen the Polling Interval to lengthen the time period in which to retain the data. The time period in which the data is retained will not exceed the Maximum Time Range configured for the graph. See Determine the Maximum Time Range for a Graph for more information.
To pause a graph, set the Polling Interval to 0 (zero).
To change the Polling Interval for a graph:
In the Polling Interval (secs) attribute, type the number that represents how often you want NNMi to request new data point sets.
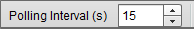
Press Enter. The new Polling Interval takes effect after the next data display. For example, if you change the Polling Interval from 1 minute to 15 seconds, the graph waits until the 1-minute interval is completed, displays the additional data, and then begins waiting 15 seconds between data requests.
NNMi enables you to pan to a specified time segment of the graph. For example, you might want to focus on a particular day or a particular peak period. using the Timeline Viewer (Flash-based graph ) or Focus Chart (Non-Flash based graph) that appears below the graph.
Flash-based real time graph:
NNMi enables you to pan a specific time segment of the graph using Timeline Viewer that appears below the graph.
If the Timeline Viewer is not displayed, select View → TImeline Viewer.
You can also use the Zoom factor to select a time segment. See Change the Zoom Value for a Graph for more information.
To select a time segment on a Flash-based graph:
NNMi displays the timestamp of the time segment end point as you as move the slider.
- Move the left side of the slider in the Timeline to indicate the beginning of the section you want to display.
Move the right side of the slider in the Timeline to indicate the end of the section you want to display.
NNMi displays the results of your selection in the graph as shown in the previous example.
Non-Flash based real time graph:
NNMi enables you to pan a specific time segment of the graph using the Context Chart that appears below the graph (Focus Chart).
The following example uses the Context Chart to select a time segment on the graph.
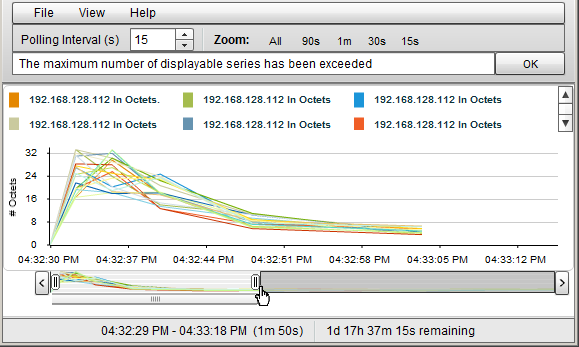
The Non-Flash based real time graph is the recommended tool to generate Line Graphs. The Line Graphs will appear different when generated using Flash-based tools.
As shown in the example above, the Timeline highlights the section of the data that you chose to display in the graph and continues to display all of the data available.
To select a time segment on a Non-Flash based graph:
Click, drag and release the mouse pointer in the Context Chart to select the time segment you want to display in the Focus Chart.
The selected time segment remains highlighted.
To increase or decrease the selection in the Context Chart, click the edge of the current highlight, drag and release the mouse pointer on either side of the current selection.
You can move the selected area to the left or right of the Context Chart to view the time segment you want to display in the Focus Chart.
The Focus Chart continues to display the time segment that you chose in the Context Chart even when additional data is available. However, if you select the time segment at the end of the Context Chart, the Focus Chart displays the current available data.
By default, NNMi locks the Y-axis so that it remains fixed at the minimum and maximum values for the current set of data regardless of the time segment selected. This means NNMi does not automatically re-adjust the Y-axis to match the data values for the selected time segment.
You can choose to unlock the Y-axis so that NNMi automatically adjusts the increments on the Y-axis. As the data values change, all of the data points fit on the graph. When using the Timeline Viewer to focus on a specified time segment, NNMi also automatically re-adjusts the increments on the Y-axis as new data is received.
For example, suppose the minimum value for the current data set is 0 and the maximum value is 20. In this case the Y-axis increments would range from 0 to 20. If you select a time segment in which the data points range from 0 to 5 and you lock the Y-axis, the increments remain fixed at 0 to 20. If you unlock the Y-axis, NNMi automatically adjusts the Y-axis increments from 0 to 5 and enlarges the graph accordingly.
This option is useful when you have a wide range of data and you are viewing a series of time segments.
By default, the Lock Y-Axis option is on.
To unlock the Y-axis when viewing time segments of the graph:
Select View → Lock Y-Axis
The check mark no longer appears next to the Lock Y-axis option to indicate the Y-axis is not locked.
To lock the Y-axis when viewing time segments of the graph:
Select View → Lock Y-Axis
A check mark appears next to the Lock Y-axis menu option to indicate the Y-axis is locked.
Switch the Y-Axis Scale for a Graph
NNMi enables you to view real-time SNMP data for selected nodes or interfaces on a linear or logarithmic scale. You can switch the Y-Axis scale between linear and logarithmic scales based on the magnitude of SNMP data for the selected node or interface.
This option is useful when you have a wide range of data.
To switch the Y-axis from linear to logarithmic scale:
Select View → View In a Logarithmic Scale
The graph appears in a logarithmic scale.
To switch the Y-axis from Logarithmic to Linear scale:
Select View → View In a Linear Scale
The graph appears in a linear scale.
NNMi enables you to change the Zoom number on a graph. For example, you might want to focus on a specified time interval that indicates peak traffic for a node or interface.
You can also move the slider in the Timeline Viewer that appears below the graph to zoom in on the area in which you want to focus. See Select a Time Segment Using the Timeline Viewer for more information.
To change the Zoom for a graph:
Select one of the Zoom numbers displayed in the top of the graph.
In the following example the Zoom choices are All, 5 minutes (5m), 3 minutes (3m), 2 minutes (2m), and 90 seconds (90s):
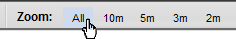
Note the following:
- The All value displays all of the data available.
- The Zoom values might change depending on the Polling Interval specified.
An NNMi graph enables you to display data values at any point in time represented in the graph.
To display data values at a specified point in time:
Mouse over the location of interest.
NNMi displays the numeric value for each graphed object below the Focus Chart as shown in the following example:
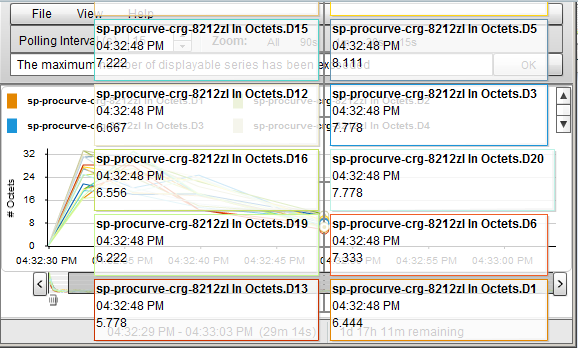
The Non-Flash based real time graph is the recommended tool to generate Line Graphs. The Line Graphs will appear different when generated using Flash-based tools.
The NNMi administrator specifies the Maximum Time Range in which the data in a graph should be retained. After the Maximum Time Range number is reached, NNMi discards the oldest data point sets so that it can display the most recent data for the time range specified. For example, if the Maximum Time Range is 24 hours, when 24 hours has passed, NNMi removes data starting with the initial data point set so that it can display data for the most recent 24-hour interval.
To determine the Maximum Time Range for a graph use the graph status bar. The status bar displays the following information:
The start and end time indicating the time interval in which data has been collected for the graph. NNMi updates this time at each Polling Interval. Any time NNMi removes older data from the graph, the start time in which data has been collected for the graph changes to indicate the new start time.
- The total time in which data has been collected for the graph.
- The time remaining before the Maximum Time Range is reached.
In the following example, the total time in which data has been collected for the graph is 33 seconds (33s). The time remaining before the Maximum Time Range is reached is 1 day, 17 hours, 38 minutes, and 30 seconds (1d 17h 38m 30s remaining)

NNMi displays a Warning message if it is unable to graph the data for the Maximum Time Range specified. You can increase the Polling Interval to lengthen the time period in which the data remains current. The time period in which the data remains current will not exceed the Maximum Time Range configured for the graph.
NNMi enables you to print a graph using the graphs's File menu. NNMi automatically scales all information included in the graph window to fit the printed page.
To print a graph:
Select File → Print to access the Print dialog box and send the graph contents to the designated printer.
NNMi enables you to export a Line Graph to a Comma-Separated Values (CSV) file. NNMi exports the data collected only for the lines displayed on the graph. (To change the lines displayed use the File → Select Lines option.)
To export a graph to a CSV file:
- Display the Line Graph that contains the data you want to export.
Select File → Export to CSV .
NNMi uses the graph Name as the .csv file name.
- Click Save to save the file.
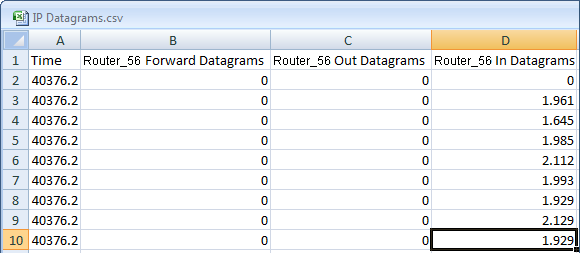
As shown in the following example, NNMi creates the CSV file using the following format:
- The first column lists each time stamp in which data is collected.
- Each row contains the data per line for the specified time.
- Each column represents a line in the graph.
Note the following:
- By default, NNMi exports the time as a decimal value. This number represents the number of days since Jan 1, 1900. To format the time as a date value, in the CSV file, right-click the Time column, select Format Cells, and select Date.
- Blank or null values indicate that NNMi was unable to collect data from the device.
- A value of 0 (zero) represents a valid value collected from the device for the specified timestamp.
Related Topics