


Monitor with Map Views
NNMi provides four kinds of map views that show a graphical representation of a selected device and the devices connected to it (Node Group Map views, Layer 2 Neighbor View, Layer 3 Neighbor View, and Path View).
Map views are useful for the following tasks:
- Identify important connector devices, such as a switch that might be a single connection to a main office or campus.
- Identify how many devices are served by a node or interface.
- Identify routing issues.
- Identify network issues between two nodes.
Each node on the map is represented by a map symbol. Each map symbol has a background shape and a foreground image. The background shape conveys two pieces of information:
- The type of device indicated by shape. See About Map Symbols.
- The most recent health status represented by the background color. See About Status Colors.
The foreground image assists in identifying the device model. NNMi uses first the Family, then Vendor, and then the Category device profile information to determine the foreground image to be displayed. If there is no image defined for any of these attributes, NNMi displays *no* icon in the map node.
Some NNMi users can delete nodes and other objects from the NNMi database (depending on the assigned NNMi Role). Any node that has been deleted appears as a transparent icon to all NNMi users until their map is refreshed using the  Refresh icon. After Refresh, the deleted node is removed from the map. NNMi does not automatically refresh the connectivity or set of nodes in a map view, except on the Initial Discovery Progress and Network Overview maps.
To monitor your network using a network map:
- Watch Status Colors
- Determine Problem Scope
- Access a Problem Device
- Access Node Details
- Export Maps to Microsoft® Visio
Watch Status Colors
When monitoring the network using a map view, watch for nodes that have a Status color of non-Normal. The background shapes of the map symbols change color based on the current health status of the represented device.
Note the following:
- NNMi uses Conclusions to determine an object's Status. Therefore, an object with a non-Normal Status does not always have an open incident associated with it. See The NMMi Causal Engine and Object Status for more information about incidents, conclusions, and object Status.
-
If NNMi determines that it requires more time to complete its analysis for an object, one of the following occurs:
-
There is a delay between the change in object Status and any associated open incident.
-
NNMi determines that the incident does not apply and the incident is not generated.
For example, when an address is not responding to ICMP, the Status of the address is set to Critical, but the incident is delayed until the NNMi Causal Engine determines whether the address is in the shadow of a node that is down. If the address is in the shadow of node that is down, NNMi does not generate an Address Not Responding incident. If the address is not in the shadow of a node that is down, NNMi generates the Address Not Responding incident. See Node Down for more information about objects that are in the shadow of a node.
-
-
If Dampening is configured for the incident, one of the following occurs:
-
There is a delay between the change in object Status and any associated open incident.
To see an incident that has a Lifecycle State of Dampened, in the NNMi console, select either the Custom Incidents or Open Custom Incidents view and set the Lifecycle State Filter to Dampened.
-
NNMi determines that the incident does not apply and the incident is automatically deleted.
If you are an NNMi administrator, see Dampening Incident Configurations for more information.
-
-
If the Incident Configuration is suppressed, NNMi does not display the incident. If you are an NNMi administrator, see Suppress Incident Configurations for more information.
To view the nodes that have an open associated incident from a Node Group Topology Map view, click  Indicate Key Incidents. This option enlarges each object on the map that has an associated open incident. This option is available only with Node Group maps.
The following table describes the meaning for each Status color that might appear on a map. The Status categories are listed in decreasing order of Severity.
| Color | Meaning | Description |
|---|---|---|

|
Unknown |
Indicates one of the following:
|

|
Disabled | Indicates the object is administratively "disabled". (For example: for an interface, the current value of the MIB-II ifAdminStatus is "disabled".) |

|
Critical | Indicates NNMi detected problems that require immediate attention. |

|
Major | Indicates NNMi detected problems that could precede a critical situation. |

|
Minor | Indicates NNMi has detected problems related to the associated object that require further investigation. |

|
Warning | Indicates there might be a problem related to the associated object. |

|
Normal | Indicates there are no known problems related to the associated object. |

|
No Status |
Indicates that NNMi monitoring configuration specifically excludes this device. The Status is either not calculated or the device is Not Managed/Out Of Service. In Path View maps, note the following:
|

|
Node Not Accessible |
Indicates a node that you cannot access according to your Security Group membership. For example in a Path View, NNMi might include information about all nodes in the path, whether you can access additional information about each node. This Status might also indicates that a node has been removed from the NNMi database since the last |
Determine Problem Scope
Maps are a useful tool for determining the scope of a problem. Scan the map to determine the scope of the problem. For example, look for large clusters of non-normal color icons to determine if there is a large-scale outage.
If your naming scheme is based on node location, you might also be able to determine if the problem is isolated to a particular site or store.
Access a Problem Device
Using NNMi's Actions menu you can access the following commonly used tools to investigate device access and configuration information:
- Verify that the node can be reached by using ping, see Test Node Access (Ping)
- Use telnet to access the device and determine more information, see Establish Contact with a Node (Telnet or Secure Shell).
- Use traceroute to view traffic paths, see Find the Route (traceroute).
Access Node Details
Select any node symbol on the map, and display all of the information related to that specified node. The Node form is useful for troubleshooting purposes:
- List of the conclusions that led to the current status, and information about status calculations for the node over time.
- Status of each interface contained in the node. For example, if the node is not completely down, you might want to see which interfaces are down.
- Status of each address associated with this node.
- System contact information.
- All of the incidents associated with the node.
NNMi also provides an Analysis Pane that displays information about a selected object.
To view all details associated with a map object:
- In a map view, select the object.
- Click the
 Open icon in the tool bar.
 - The form displays, containing details of all information related to the object.
- View or edit the details of the selected object.
Access the Analysis Pane from a table view:
- Select the workspace of interest (for example,
 Inventory).
 - Select the view that contains the object of interest (for example, the Nodes view).
- Select the row that contains the object of interest.
- NNMi displays detailed information at the bottom of the view in the Analysis Pane.
- Select the workspace of interest (for example,
Access the Analysis Pane in a map view:
- Select the workspace of interest (for example,
 Topology Maps).
 Select a map view (for example, select Routers).
If the map requires a starting node before it opens, enter the name or IP Address for the starting node you want to use.
- Click the map object of interest.
- NNMi displays detailed information at the bottom of the view in the Analysis Pane.
- Select the workspace of interest (for example,
Access the Analysis Pane in a form:
Click the form's toolbar
 Show Analysis icon to display information about the current form's top-level object in the Analysis Pane. Show Analysis always displays the top-level object's information.
- Click a row in a table on one of the form's tabs to display detailed information about the selected object in the Analysis Pane.
NNMi displays detailed information at the bottom of the form in the Analysis Pane. See Working with Objects for more information about forms.
Open the Analysis Pane if necessary by clicking the
 expand button in the Analysis Pane banner bar:
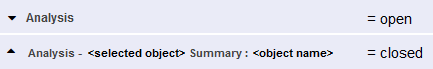
If you change views, NNMi clears the Analysis Pane. The Analysis Pane remains blank unless an object is selected.
If you select multiple objects, the Analysis Pane displays data about the first selected object.
Using the Analysis Pane:
- To resize, place your mouse cursor over the title bar to display the ↕ symbol and drag to adjust the size.
To refresh a subset of information in the Analysis Pane, click any displayed
Refresh icon .To refresh all data in the Analysis Pane, open the object's form and click
Refresh or  Save.
Save.- To launch an SNMP Line Graph for the selected metric, click the icon that appears at the bottom of each gauge.
- To select and copy the tooltip information, double-click the gauge. NNMi opens a text window that enables you to select and copy the tooltip information.
The Gauges tab shows real-time SNMP gauges to display State Poller and Custom Poller SNMP data.
- These gauges are displayed for Nodes, Interfaces, Custom Node Collections, and for Node Sensors of type CPU, Memory, or Buffers, and Physical Sensors of type Backplane.
NNMi displays a gauge for each significant MIB Object Identifier (OID) that the node or interface supports, up to the default maximum of 24.
Each gauge displays the current OID value, using the default refresh rate of 15 seconds.
- The value range displayed indicates the OID minimum and maximum values that NNMi has encountered.
- For any gauge that tracks percentage values, NNMi uses a red line to indicate where the OID value is near 100 percent.
There is not a one-to-one match between the OIDs used to analyze monitoring thresholds and those displayed in the Analysis Pane. For example, the Analysis Pane might display a Cisco Memory Pool OID value that does not match the value used to calculate whether the Memory Utilization Monitored Attribute threshold is reached or exceeded. This is because some threshold metrics require more complex calculations than a single OID allows.
If a gauge label appears to be a duplicate value, mouse over the label to view the more complete tooltip name that appears.
Access All Related Incidents
If you are using a map view to monitor your network, there are times when you might want to switch to an incident view for more information. Information available from an incident view includes the first time a notification was received, the description of the problem (for example, Node Down or Address Not Responding), and the incident category. The incident category helps to identify the type of problem, such as fault, performance, or security.
To display all incidents related to an object on a map:
- Click to select the node or interface of interest.
- Click the Open icon to open the form.
- Select the Incidents tab.
- The incidents table includes all incidents associated with the node or interface. Double-click the row representing the incident that you want to examine. See Incident Form.
Requires Network Node Manager iSPI Network Engineering Toolset Software (NNM iSPI NET).
If you are using a map view to monitor your network, there are times when you might want to export topology maps displayed in NNMi to Visio documents for later use. NNMi enables you to export the current map or all Node Group maps that are configured to be exported. See "Help for Administrators" for more information about how to configure Node Group maps.
Vendor-specific icons are not exported.
If you are using Internet Explorer as your Web browser, before exporting topology maps to Visio, make sure the NNMi management server is a trusted site and that File Downloads is enabled. Click here for more information.
To add the NNMi management server as a trusted site:
- Select Tools → Internet Options.
- Navigate to the Security tab.
- Select Trusted Sites.
- Click Sites.
- In the Add this website to the zone field, enter the url to the NNMi management server and click Add.
- Click OK to save your changes and close the Trusted Sites dialog.
To enable File Downloads:
- Select Tools → Internet Options.
- Navigate to the Security tab.
- Select Trusted Sites.
- Click Custom Level.
- Navigate to the Automatic prompting for file downloads.
- Select Enable.
- Navigate to File download.
- Select Enable.
- Click OK to save your changes and close the Security Settings dialog.
- Click OK to close the Internet Options dialog.
To export the current map to a Visio diagram:
- Navigate to the map of interest. For example, select Node Group Overview from the Topology Maps workspace.
- Select Tools → Visio Export → Current Map.
- Select Include Node Status Color if you want to export the current Status color for each node.
Select Include connection labels if you want to export all of the connection labels. Including connection labels increases the file size. If you are concerned about file size, do not export the connection labels.
Click OK.
In the browser dialog, specify whether you want to Open or Save the .vdx file.
NNMi creates a Visio (.vdx) file that contains a single page with the current map view rendered as a Visio diagram.
To export all Node Group maps configured to be exported:
Select Tools → Visio Export → Saved Node Group Maps.
Only those Node Group maps that have been properly configured by enabling the Include in Visio Export check box in the Node Group Map Settings form are included in the Visio Export. If a Node Group Map has not been saved using Save Map, the positions of each node in the export will not match any changes you made in your Map view. See Position Nodes on a Node Group Map for more information.
- Select Include Node Status Color if you want to export the current Status color for each node.
Select Include connection labels if you want to export all of the connection labels.
Including connection labels increases the file size. If you are concerned about file sizes, do not export the connection labels
Click OK
In the browser dialog, specify whether you want to Open or Save the .vdx file.
NNMi creates a Visio (.vdx) file that contains a separate page for each Node Group map rendered as a Visio diagram.
You can also annotate a Node Group map that is exported to Microsoft® Visio. See Add Annotations to a Map for more information.
View the Details for a Map Object on an Exported Visio Diagram
Requires Network Node Manager iSPI Network Engineering Toolset Software (NNM iSPI NET).
When viewing an NNMi topology map that was exported to Visio, you can view the details for a map object that is stored in the NNMi database using the View menu.
To view the details for a map object on a map that was exported to Visio:
- Open the Visio diagram of interest.
- Select the map object of interest.
Select View → Task Panes → Shape Data.
If the object is stored in the NNMi database, NNMi displays the details available for the selected object.
Print an Exported Visio Diagram
Requires Network Node Manager iSPI Network Engineering Toolset Software (NNM iSPI NET).
When printing an NNMi topology map that was exported to Visio, use the Visio File menu to make sure all of your map contents print to one page.
To print a map exported to a Visio diagram:
- Open the Visio diagram of interest.
- Select File → Print → Print Preview → Page Setup.
- Navigate to the Print Setup tab.
- Click Fit to sheet(s) across.
- Click OK to save your changes and close the Page Setup dialog.
- Use the File → Print menu to print the Visio diagram.
Related Topics
Export Maps to Microsoft® Visio
Hide Connections or Connection Labels from an Exported Visio Diagram
Print an Exported Visio Diagram
View the Details for a Map Object on an Exported Visio Diagram
Display the Layer 2 Neighbor View