


[This is the Context-Sensitive Help topic for the Interface form.]
Click the link to the object type you selected prior to opening the Interface form:
-
interface — might be a physical or virtual interface
For example, the interface might be a virtual port or an uplink provided by a hypervisorThe virtual machine manager in charge of delegating various aspects from a pool of resources to become virtual devices. The delegations might be static or dynamic, depending on the manufacture's implementation. The type of virtual machines being generated depends on the manufacturer's implementation..
- virtual switch
The Interface form provides details about the physical or virtual network interface selected. From this form you can access more details about the parent node, addresses, current network connection, and incidents associated with this interface.
If your role permits, you can use this form to modify the Management Mode for an interface (for example to indicate it will be temporarily out of service) or add notes to communicate information about this interface. This topic includes the following sections:
- General Tab
- Ports Tab
- VLAN Ports Tab
- WAN Connections Tab
- Link Aggregation Tab (NNMi Advanced)
- Performance Tab (NNM iSPI Performance for Metrics)
- IP Addresses Tab
- Capabilities Tab
- Custom Attributes Tab
- Interface Groups Tab
- Incidents Tab
- Status Tab
- Conclusions Tab
- Registration Tab
- Virtual Switch's Interface Form (NNMi Advanced)
If you see several blank columns for an interface in a table view, note the following:
-
The interface might be in a non-SNMP node.
For interfaces on non-SNMP nodes, note the following:
- The interface index (
ifIndex) value is always set to 0 (zero). - The interface type (
ifType) is set to Other. -
The interface Name (
ifName), if none is available, is set to Pseudo Interface.For Pseudo Interface, NNMi attempts to obtain additional information using a variety of discovery protocols (see the list of Topology Source protocols in Layer 2 Connection Form).
- If the interface hosts an IP address, the interface Alias (
ifAlias) is set to the IP address. Otherwise, the interface Alias (ifAlias) is set with information from neighboring SNMP devices. - NNMi obtains the MAC address if the IP address can be resolved using ARP cache.
- The interface index (
-
The interface might be a Nortel private interface.
For Nortel SNMP interfaces, note the following:
- The interface index (
ifIndex) value is set according the Nortel private MIB. - NNMi tries to collect the MAC address and interface name using Nortel's private MIBs.
- The interface index (
-
(NNMi Advanced) The interface might be an IPv-6 interface.
A small number of IPv6 devices do not support the standard RFC 2863 IF-MIB for IPv6 interfaces. In this case, NNMi uses the RFC 2465 IPv6-MIB. When this happens, note the following:
- Interface index (
ifIndex) and description (ifDescr) are set according to the RFC 2465 IPv6 MIB. - Interface type (
ifType) is set toOther(no specific type is available). - Interface Name (
ifName), Alias (ifAlias), and Speed (ifSpeed) are blank (not available). - NNMi monitors the Status of this interface, but Performance metrics are not available.
When an IP Address has the Interface Name (
ifName) attribute set to blank, NNMi constructs an alternate string for the IP Address's In Interface attribute (Other[<ifIndex_value>]). - Interface index (
For information about each tab: ![]() See Also
See Also
| Attribute | Description |
|---|---|
| Name | The most accurate interface name available to the initial discovery process. First choice is the IF MIB ifName value. Second choice is the ifAlias value. Third choice is a combination of the ifType[ifIndex] value (for example, ethernetCsmacd[17]).
|
| Status |
Overall status for the current interface. NNMi follows the ISO standard for status classification. See the Interface Form: Status Tab for more information. Possible values are:
Interface status is derived from SNMP polling results for ifAdminStatus and IfOperStatus, as well as from any conclusions. Status reflects the most serious outstanding conclusion. See the Interface Form: Conclusions Tab for information about how the current status was determined. See Watch Status Colors for more information about possible status values. The icons are displayed only in table views. |
| Management Mode |
The calculated Management Mode for the interface according to the Management Mode Hierarchy. This value reflects the current management mode of this interface's parent object (the Hosted On Node). See How NNMi Assigns the Management Mode to an Object. (NNMi Advanced - Global Network Management feature) Any change to this Management Mode setting is sent from a Regional Manager to the Global Manager during the next Spiral Discovery cycle on the Regional Manager. If the NNMi Security configuration permits, you can change this setting using Actions → Management Mode.You can also right-click any object in a table or map view to access the items available within the Actions menu. |
| Direct Management Mode |
Indicates whether or not NNMi is currently monitoring the interface. Possible values are:
NNMi administrators and Level 2 Operators can use the drop-down selection list to change the current setting. If you change the Direct Management Mode using Actions → Management Mode, NNMi updates the calculated Management Mode on the form. If you manually set the Direct Management Mode and then Save your changes, the Management Mode value is not updated until you refresh the form. |
| Hosted On Node |
The node in which the interface resides. This is the current value in the NNMi database for the Name attribute of the host device. The value could be a DNS name, a MIB-II sysName, or an address (depending on how your NNMi administrator configured the discovery process). Click the |
| Physical Address |
The interface address at the physical layer, also known as the MAC address. This is the globally unique serial number assigned to each interface at the factory. |
| Layer 2 Connection |
Used to indicate whether the selected interface is part of a Layer 2 Connection. If the interface is part of a connection, use this attribute to access information about its Layer 2 Connection and the neighboring device. Click here for instructions.
|
 No Status
 Normal
 Disabled
 Unknown
 Warning
 Minor
Minor Major
Major Critical
 Inherited – Used to indicate that the interface should inherit the Management Mode from this interface's parent object (the Hosted On Node).
 Not Managed – Used to indicate that NNMi does not discover or monitor the interface. For example, the interface might not be accessible because it is in a private network.
 Out of Service – Used to indicate an interface is unavailable because it is out of service or participating in a
  Show Analysis or
 | Attribute | Description |
|---|---|
| Administrative State |
The current Administrative State provided by:
This value contributes towards the status calculation for this interface. See the Interface Form: Status Tab for more information. Possible values are:
The following values indicate NNMi could not gather the required data:
|
| Operational State |
The current Operational State provided by:
This value contributes towards the status calculation for this interface. See the Interface Form: Status Tab for more information. Possible values are:
The following values indicate NNMi could not gather the required data:
|
| State Last Modified |
(NNMi Advanced - Global Network Management feature) The text you enter here is not sent from a Regional Manager (NNMi management server) to the Global Manager. NNMi administrators for the Global Manager can add notes that are stored in the NNMi database on the Global Manager. The date and time when the Administrative State, Operational State, or both were last modified. |
| Notes |
Provided for network operators to use for any additional notes required to further explain the interface. Information might include to what service or customer the interface is connected. Type a maximum of 1024 characters. Alpha-numeric, spaces, and special characters (~ ! @ # $ % ^ & * ( ) _+ -) are permitted. You can sort your interface table views based on this value. Therefore, you might want to include keywords for this attribute value. |
 Up – The interface is ready to pass packets of data.
 Down – The interface is not available to pass packets of data.
 Testing – The interface is in test mode.
 Other – The Administrative State reported is not a recognized value.
 Agent Error – Indicates an error was returned in response to the query.
 No Polling Policy - No polling policy exists for this monitored attribute.
 Not Polled - Indicates that this attribute is intentionally not polled, based on current Monitoring Configuration settings, current Communication Configuration settings, or because the parent Node is set to Not Managed or Out of Service. This object attribute might or might not have an associated polling policy.
 Not Provided — The device does not support providing information for this monitored attribute.
 Unavailable - The agent responded with a value outside the range of possible values or returned a null value.
 Unset – Currently not used by NNMi.
 Dormant – Indicates interface is in a "pending” state, waiting for some external event.
 Lower Layer Down – Indicates the interface is down due to the state of lower-level interfaces.
 Minor Fault – The interface is still functional, but a minor concern was detected. Check the device, itself, for more details.
 Not Present – Indicates that the interface is missing.
 Unknown – The Operational State value could not be detected.
[This is the Context-Sensitive Help topic for the Interface form, General tab.]
The Interface Form provides details about the selected network interface.
For information about each tab: ![]() See Also
See Also
| Attribute | Description |
|---|---|
| ifName |
Optional Interface MIB variable for ifName () assigned to the interface by the vendor. If no IfName value is provided, SNMP uses the ifType+ifIndex which is dynamically configured and can change. This name is not guaranteed to be unique or consistent across reboots. |
| iIfAlias |
Optional Interface MIB variable for ifAlias assigned to the interface. This value is set by the device administrator. An ifAlias could be useful if the interface vendor did not provide an ifName value. |
| ifDescr |
Optional Interface MIB variable for ifDescr (1.3.6.1.2.1.2.2.1.2) for the interface. This attribute is set by the device administrator. |
| ifIndex |
Interface MIB variable for the row number in the interface table (ifTable) for this interface. The row number can change. If you are an Administrator, see Accurately Detect Interface Changes for more information. Interfaces on non-SNMP nodes have an ifIndex value of 0 (zero). |
| ifSpeed |
Interface MIB variable for the interface’s bandwidth in bits per second. Depending on the device vendor, this value might indicate current speed or potential speed. |
| ifType |
Interface MIB variable for the physical link protocol type of the interface. Possible values include: other. |
|
Requires Network Node Manager iSPI Performance for Metrics Software (NNM iSPI Performance for Metrics). To populate performance data in the dashboard views or enhance NNM iSPI Performance for Metrics reports by sharing NNMi configuration settings, install the optional Network Performance Server (NPS). |
|
| Input Speed |
(NNM iSPI Performance for Metrics) If the Network Node Manager iSPI Performance for Metrics Software is installed and configured within your environment, you can type an integer value to override the input speed value returned by the device's SNMP agent. Indicate the speed this interface is capable of receiving data in bits per second. For example, you might want to override the Input Speed value for the following reason: Sometimes the value returned by the device's SNMP agent is not accurate or causes problems when NNM iSPI Performance for Metrics calculates performance monitoring. For example, the input speed might be restricted due to circumstances in your environment, or bandwidth controls might limit the connection speed regardless of what the physical connection is capable of (such as within a WAN). (NNMi Advanced - Global Network Management) If you change this value for an Interface monitored by a Regional Manager, NNMi forwards the updated information to the Global Manager at the next Discovery Interval. If you are an NNMi administrator, you can set input speeds for multiple interfaces using the nnmsetiospeed.ovpl command. Also see "Maintaining NNMi" in the Network Node Manager i Software Deployment Reference for more information. |
| Output Speed |
(NNM iSPI Performance for Metrics) If the Network Node Manager iSPI Performance for Metrics Software is installed and configured within your environment, you can type an integer value to override the output speed value returned by the device's SNMP agent. Indicate the speed this interface is capable of transmitting data in bits per second. For example, you might want to override the Output Speed value for the following reason: Sometimes the value returned by the device's SNMP agent is not accurate or causes problems when NNM iSPI Performance for Metrics calculates performance monitoring. For example, the output speed might be restricted due to circumstances in your environment, or bandwidth controls might limit the connection speed regardless of what the physical connection is capable of (such as within a WAN). (NNMi Advanced - Global Network Management) If you change this value for an Interface monitored by a Regional Manager, NNMi forwards the updated information to the Global Manager at the next Discovery Interval. If you are an NNMi administrator, you can set output speeds for multiple interfaces using the nnmsetiospeed.ovpl command. Also see "Maintaining NNMi" in the Network Node Manager i Software Deployment Reference for more information. |
[This is the Context-Sensitive Help topic for the Interface form, IP Addresses tab.]
The Interface Form provides details about the selected network interface.
For information about each tab: ![]() See Also
See Also
| Attribute | Description |
|---|---|
| IP Address |
Table view of the IP addresses associated with the selected interface. You can use this table to determine the state and address for each IP address. Double-click the row representing an IP address. The IP Address Form displays all details about the selected IP address. |
[This is the Context-Sensitive Help topic for the Interface form, Ports tab.]
The Interface Form provides details about the selected network interface.
For information about each tab: ![]() See Also
See Also
|
Attribute |
Description |
|---|---|
|
Ports |
Table view of all of the ports associated with the selected interface. Use this table to access information about each port associated with the selected interface. Double-click the row representing a port. The Port Form displays all details about the selected port. |
[This is the Context-Sensitive Help topic for the Interface form, VLANs tab.]
The Interface Form provides details about the selected network interface.
For information about each tab: ![]() See Also
See Also
(NNMi Advanced - Global Network Management feature) There might be slight differences between the VLAN information shown on Regional Managers and Global Managers, because the VLAN calculations use Layer 2 Connections data.
| Attribute |
Description |
|---|---|
| VLAN Ports |
Table view of all of the VLAN ports associated with the current interface. Use this table to determine all port and VLAN combinations associated with this interface. Double-click the row representing a VLAN port. The VLAN Port Form displays all details about the selected VLAN port. |
[This is the Context-Sensitive Help topic for the Interface form, WAN Connections tab.]
The Interface Form provides details about the selected network interface.
For information about each tab: ![]() See Also
See Also
|
Attribute |
Description |
|---|---|
|
WAN Connections |
Table view of both of the interfaces that are part of the current connection. You can use this table to determine the administrative state, operational state, name, customer edge IP address, and last modified state for each interface associated with the selected WAN Connection. Double-click the row representing an interface. The Interface Form displays all details about the selected WAN Connection. |
[This is the Context-Sensitive Help topic for the Interface form, Link Aggregation tab.]
The Interface Form provides details about the selected network interface.
For more information about each tab: ![]() See Also
See Also
The Interface Form: Link Aggregation Tab appears if the selected interface uses a Link Aggregation protocol.

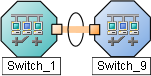
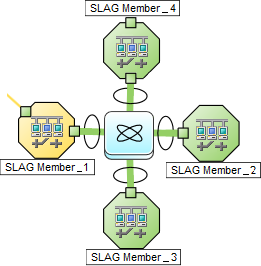
On a Layer 2 map, a thick line with a superimposed ellipse represents a Link AggregationProtocols used on Switches to configure multiple Interfaces (Aggregation Member Interfaces) to function as if they were one (an Aggregator Interface). When two Aggregator Interfaces establish a connection, that connection is an Aggregator Layer 2 Connection. The Aggregator Layer 2 Connection appears on Layer 2 Neighbor View maps as a thick line with an Interface icon at each end (representing the Aggregator Interface). or Split Link AggregationLink Aggregation with more than two endpoints. Some vendors refer to this as Multi-Chassis Link Aggregation, SLAG, MLAG, or MC-LAG. (group of multiple Layer 2 Connections that are functioning as one). The icon representing an Interface at either end of the thick line is an Aggregator Interface (a logical interface comprised of many physical interfaces that are functioning as one).
|
Two endpoints:
|
Three endpoints:
|
More than three endpoints:
|

The selected object's role in the Link Aggregation determines the contents of the tab:
-
Aggregation Member, click here for details.
Attribute Description Link Aggregation Protocol The Link AggregationProtocols used on Switches to configure multiple Interfaces (Aggregation Member Interfaces) to function as if they were one (an Aggregator Interface). When two Aggregator Interfaces establish a connection, that connection is an Aggregator Layer 2 Connection. The Aggregator Layer 2 Connection appears on Layer 2 Neighbor View maps as a thick line with an Interface icon at each end (representing the Aggregator Interface). or Split Link AggregationLink Aggregation with more than two endpoints. Some vendors refer to this as Multi-Chassis Link Aggregation, SLAG, MLAG, or MC-LAG. Protocol currently in use. These protocols allow network administrators to configure a set of interfaces on a switch as one Aggregator Interface, creating an Aggregator Layer 2 Connection to another device using multiple interfaces in parallel to increase bandwidth, increase the speed at which data travels, and increase redundancy:
Text Represents This Protocol Cisco Port Aggregation Protocol Cisco Systems Port Aggregation Protocol (pagp) Nortel Multi-Link Trunking Nortel Multi-Link Trunk technology (mlt) Split MLT Split Multi-Link Trunk: configuration technology (splitMlt) Inter-Switch Trunk MLT Split Multi-Link Trunk: inter-switch trunk (istMlt) 802.3ad Link Aggregation Control Protocol IEEE 802.3ad Link Aggregation Control protocol (LACP) Static/Manual Configured Link Aggregation Static/Manual Configured Link Aggregation Unknown Protocol Link Aggregation unknown It is possible for a Layer 2 Connection to connect sets of Aggregator/Member Interfaces that are configured using different Link Aggregation protocols. In that case, this attribute value contains multiple protocols separated with a slash (/).
nms.topo.core.capability.lag.protocol.PAGP=Cisco Port Aggregation Protocol
nms.topo.core.capability.lag.protocol.MLT=Nortel Multi-Link Trunking
nms.topo.core.capability.lag.protocol.SMLT=Split MLT
nms.topo.core.capability.lag.protocol.ISTMLT=Inter-Switch Trunk MLT
nms.topo.core.capability.lag.protocol.LACP=802.3ad Link Aggregation Control Protocol
nms.topo.core.capability.lag.protocol.STATIC=Static/Manual Configured Link Aggregation
nms.topo.core.capability.lag.protocol.UNKNOWN=Unknown Protocol Link Aggregation
Aggregator Name of the Aggregator that contains the selected participating Aggregation Member:
- Aggregator Interface - represents multiple member interfaces
- Aggregator Layer 2 Connection - thick line on the Layer 2 map represents multiple member Layer 2 Connections
See Layer 2 Neighbor View Map Objects for more information.
Click the
 Lookup icon, and choose
  Open to open the form for the Aggregator.
 -
Aggregator (representing multiple members), click here for details.
Attribute Description Link Aggregation Protocol The Link AggregationProtocols used on Switches to configure multiple Interfaces (Aggregation Member Interfaces) to function as if they were one (an Aggregator Interface). When two Aggregator Interfaces establish a connection, that connection is an Aggregator Layer 2 Connection. The Aggregator Layer 2 Connection appears on Layer 2 Neighbor View maps as a thick line with an Interface icon at each end (representing the Aggregator Interface). or Split Link AggregationLink Aggregation with more than two endpoints. Some vendors refer to this as Multi-Chassis Link Aggregation, SLAG, MLAG, or MC-LAG. Protocol currently in use. These protocols allow network administrators to configure a set of interfaces on a switch as one Aggregator Interface, creating an Aggregator Layer 2 Connection to another device using multiple interfaces in parallel to increase bandwidth, increase the speed at which data travels, and increase redundancy:
Text Represents This Protocol Cisco Port Aggregation Protocol Cisco Systems Port Aggregation Protocol (pagp) Nortel Multi-Link Trunking Nortel Multi-Link Trunk technology (mlt) Split MLT Split Multi-Link Trunk: configuration technology (splitMlt) Inter-Switch Trunk MLT Split Multi-Link Trunk: inter-switch trunk (istMlt) 802.3ad Link Aggregation Control Protocol IEEE 802.3ad Link Aggregation Control protocol (LACP) Static/Manual Configured Link Aggregation Static/Manual Configured Link Aggregation Unknown Protocol Link Aggregation unknown It is possible for a Layer 2 Connection to connect sets of Aggregator/Member Interfaces that are configured using different Link Aggregation protocols. In that case, this attribute value contains multiple protocols separated with a slash (/).
nms.topo.core.capability.lag.protocol.PAGP=Cisco Port Aggregation Protocol
nms.topo.core.capability.lag.protocol.MLT=Nortel Multi-Link Trunking
nms.topo.core.capability.lag.protocol.SMLT=Split MLT
nms.topo.core.capability.lag.protocol.ISTMLT=Inter-Switch Trunk MLT
nms.topo.core.capability.lag.protocol.LACP=802.3ad Link Aggregation Control Protocol
nms.topo.core.capability.lag.protocol.STATIC=Static/Manual Configured Link Aggregation
nms.topo.core.capability.lag.protocol.UNKNOWN=Unknown Protocol Link Aggregation
Available Bandwidth
Sum of the interface Input Speed attribute values of the Member Interfaces that have a MIB-II ifOperStatus that is not
Down. If the sum of the interface Output Speed attribute values is different, NNMi displays separate Available Input Bandwidth and Available Output Bandwidth attributes.Maximum Bandwidth Sum of the interface Input Speed attribute values of the Member Interfaces, regardless of MIB-II
ifOperStatus. If the sum of the interface Output Speed attribute values is different, NNMi displays separate Maximum Input Bandwidth and Maximum Output Bandwidth attributes.Available Bandwidth Percentage Percentage value computed using Available Bandwidth divided by the Maximum Bandwidth. Members Table view of the Aggregation Members.
For more information, double-click the row representing an Aggregation Member:
- The Interface Form displays all details about the selected Interface.
- The Layer 2 Connection Form displays all details about the selected Layer 2 Connection.
[This is the Context-Sensitive Help topic for the Interface form, Performance tab.]
Requires Network Node Manager iSPI Performance for Metrics Software (NNM iSPI Performance for Metrics). To populate performance data in the dashboard views or enhance NNM iSPI Performance for Metrics reports by sharing NNMi configuration settings, install the optional Network Performance Server (NPS).
The Interface Form provides details about the selected network interface.
This information is also visible in the Monitoring workspace, Interface Performance view.
For information about each tab: ![]() See Also
See Also
The Performance tab displays data if the Network Node Manager iSPI Performance for Metrics Software software is installed and configured within your environment.
The icons on the Performance tab indicate the value from the most recent polling interval for interface performance states:
|
|
The following values indicate NNMi could not gather the required data:
|
 High - The High threshold was crossed.
 Nominal - Measured within healthy range. (Or no thresholds are being monitored.)
 Low - The Low threshold was crossed.
 None - The value returned was zero.
 Abnormal Range - This interface is abnormal based on the computed baseline for the specified threshold.
 Normal Range - This interface is normal based on the computed baseline for the specified threshold.
NNMi can generate incidents based on threshold results ![]() See Also
See Also
Optional: The NNMi administrator can configure thresholds for the metrics described in the following list. If you want to see the threshold configuration settings for the currently selected Interface, click Actions → Configuration Details → Monitoring Settings, then scroll down to the Count-Based Threshold Settings table and Time-Based Threshold Settings table:
-
 FCS LAN Error Rate
Local Area Network interfaces only.Threshold based on the percentage of incoming frames with a bad checksum (CRCCyclic Redundancy Check value) compared to the total number of incoming frames. Possible causes include collisions at half-duplex, a duplex mismatch, bad hardware (NICNetwork Interface Controller, cable, or port), or a connected device generating frames with bad Frame Check Sequence.
-
FCS WLAN Error Rate
Wireless Local Area Network Interfaces only. Threshold based on the percentage of incoming frames with a bad checksum (CRCCyclic Redundancy Check value) compared to the total number of incoming frames. Possible causes include wireless communication interference, bad hardware (NICNetwork Interface Controller, cable or port), or a connected device generating frames with bad Frame Check Sequence.
-
Input Discard Rate
Threshold based on the percentage of the interface's discarded input packet count compared to the total number of packets received. Packets might be discarded because of a variety of issues, including receive-buffer overflows, congestion, or system specific issues.
-
Input Error Rate
Threshold based on the percentage of the interface's input packet error count compared to the total number of packets received. What constitutes an error is system specific, but likely includes such issues as bad packet checksums, incorrect header information, and packets that are too small.
-
Input Queue Drops Rate
Threshold based on the percentage of the interface's dropped input packets compared to the total number of packets received. Possible causes include the input queue being full.
-
Input Utilization
Threshold based on the percentage of the interface's total incoming octets compared to the maximum number of octets possible (determined by the MIB being used to query
ifSpeedof the device and whether the host system supports high-speed counters for interfaces).Sometimes the
ifSpeedvalue returned by the device's SNMP agent is not accurate and causes problems with thresholds. If your NNMi role allows, you can override theifSpeedreported by the SNMP agent:- Open the problem interface's Interface form.
- Select the General Tab.
- Locate the Input/Output Speed section.
- Change the Input Speed or Output Speed setting.
-
Output Discard Rate
Threshold based on the percentage of the interface's discarded output packet count compared to the total number of outgoing packets. Packets might be discarded because of a variety of issues, including transmission buffer overflows, congestion, or system specific issues.
-
Output Error Rate
Threshold based on the percentage of the interface's output packet error count compared to the total number of outgoing packets. What constitutes an error is system specific, but likely includes such issues as as collisions and buffer errors.
-
Output Queue Drops Rate
Threshold based on the percentage of the interface's dropped output packets compared to the total number of outgoing packets. Possible causes include all buffers allocated to the interface being full.
-
Output Utilization
Threshold based on the percentage of the interface's total outgoing octets compared to the maximum number of octets possible (determined by the MIB being used to query
ifSpeedof the device and whether the host system supports high-speed counters for interfaces).Sometimes the
ifSpeedvalue returned by the device's SNMP agent is not accurate and causes problems with thresholds. If your NNMi role allows, you can override theifSpeedreported by the SNMP agent:- Open the problem interface's Interface form.
- Select the General Tab.
- Locate the Input/Output Speed section.
- Change the Input Speed or Output Speed setting.
[This is the context-sensitive link for the Interface Form: Capabilities Tab.]
The Interface Form provides details about the selected interface.
For information about each tab: ![]() See Also
See Also
The Interface Form: Capabilities Tab displays a table view of any capabilities added to the interface object by NNMi or an external application. Capabilities enable NNMi and application programmers to provide more information about an interface than is initially stored in the NNMi database.
For example, NNMi uses the capability feature to identify interfaces for which NNMi can obtain only limited information. Examples of these interfaces include Nortel interfaces as well as any interface on a non-SNMP node. To help identify these interfaces, NNMi assigns the interface the capability of com.hp.nnm.capability.iface.private.
Because the values are generated by NNMi or an external application, Capability values cannot be modified.
(NNMi Advanced - Global Network Management feature) Any Capability values added by an NNM iSPI are available on the Global Manager only if that iSPI is also running on the Global Manager.
| Attribute | Description |
|---|---|
| Capability |
Table of all of the capabilities associated with the selected Interface. Use this table to access information about each Capability. Double-click the row representing a Capability. The Interface Capability Form displays all details about the selected Capability. For more information, see Interface Capabilities Provided by NNMi. |
The Interface Form: Capabilities Tab displays a table of any capabilities added to a particular interface object. Capabilities enable NNMi and application programmers to provide more information about an interface than what is initially stored in the NNMi database.
Additional vendor-specific capabilities may appear from device extension settings.
External applications can also add capabilities.
KEY: com.hp.<product>.capability.<content>.<vendor/org>.<MIB/feature>
Any Capability provided by NNMi begins with the prefix com.hp.nnm.capability.
<product> = Either NNMi or the NNM iSPI providing this capability.
<content> = chassis, card, ipaddr (address), iface (interface), lag (Link AggregationProtocols used on Switches to configure multiple Interfaces (Aggregation Member Interfaces) to function as if they were one (an Aggregator Interface). When two Aggregator Interfaces establish a connection, that connection is an Aggregator Layer 2 Connection. The Aggregator Layer 2 Connection appears on Layer 2 Neighbor View maps as a thick line with an Interface icon at each end (representing the Aggregator Interface). or Split Link AggregationLink Aggregation with more than two endpoints. Some vendors refer to this as Multi-Chassis Link Aggregation, SLAG, MLAG, or MC-LAG. interface), node, rrp (Router Redundancy), or metric (Node Sensor or Physical Sensor).
<vendor/org> = Standards organization or vendor defining the MIB or feature associated with the capability.
<MIB/feature> = What this capability measures.
The following tables show a few examples of the Capabilities provided by NNMi.
| Unique Key | Capability | Description |
|---|---|---|
com.hp.nnm.capability.iface.private
|
Private |
Indicates the interface was discovered in either a non-SNMP node or a Nortel node. Private interfaces are not monitored for Status. For interfaces on non-SNMP nodes, note the following:
For Nortel SNMP interfaces, note the following:
|
com.hp.nnm.capability.iface.ietf.NON-DEFAULT-CONTEXT-RFC1213
|
RFC 1213 Interface from Non-default Context |
Indicates the following:
|
com.hp.nnm.capability.iface.PE
|
PE Interface | Indicates that the interface is serving as a Provider Edge (PEProvider Edge router. The Internet Service Provider's router that receives your data on the path to your data's final desination. The Customer Edge (CE) router in your network connects to this PE.). NNMi's Subnet Connection Rules use this information. |
com.hp.nnm.capability.br.bridge
|
Virtual Bridge | Indicates that the interface represents a virtual bridge (also known as a virtual switch). |
com.hp.nnm.capability.br.port
|
Virtual Bridge Port | Indicates that the interface represents any interface associated with a virtual bridge. |
| VM Virtual Machine Interface | ||
|
Requires Network Node Manager iSPI Performance for Metrics Software (NNM iSPI Performance for Metrics). To populate performance data in the dashboard views or enhance NNM iSPI Performance for Metrics reports by sharing NNMi configuration settings, install the optional Network Performance Server (NPS). |
||
com.hp.nnm.capability.iface.ietf.DS1
|
DS1 Interface Metrics | Interface that supports the DS1 (T1) MIB for gathering performance data. This data is used by NNM iSPI Performance for Metrics. |
com.hp.nnm.capability.iface.ietf.DS3
|
DS3 Interface Metrics | Interface that supports the DS3 (T3) MIB for gathering performance data. This data is used by NNM iSPI Performance for Metrics. |
com.hp.nnm.capability.iface.ietf.ETHERLIKE
|
EtherLike Interface Metrics | Interface that supports the Etherlike MIB for gathering performance data. NNMi uses this MIB to monitor LAN errors. This data is used by NNM iSPI Performance for Metrics. |
com.hp.nnm.capability.iface.ietf.IEEE80211
|
IEEE 802.11 Interface Metrics | Interface that supports the IEEE 802.11 Interface Metrics MIB. NNMi can monitor for WLAN metrics. This data is used by NNM iSPI Performance for Metrics. |
com.hp.nnm.capability.iface.ietf.SONET
|
SONET Interface Metrics | Interface that supports the SONET-MIB interval monitoring metrics. This capability determines membership in the SONET interface group. This data is used by NNM iSPI Performance for Metrics. |
com.hp.nnm.capability.iface.ietf.SONET-PATH
|
SDH Interface Metrics | Interface that supports the SONET-PATH-MIB metrics. This data is used by NNM iSPI Performance for Metrics. |
| Unique Key | Capability | Description |
|---|---|---|
com.hp.nnm.capability.iface.ipv6.rfc2465
|
RFC2465-IPv6-Interface |
Indicates the interface is an IPv6 interface, discovered using only the RFC 2465 IPv6-MIB and not the standard RFC 2863 IF-MIB. A small number of IPv6 devices do not support the standard RFC 2863 IF-MIB for IPv6 interfaces. In this case, NNMi uses the RFC 2465 IPv6-MIB. When this happens, note the following:
When an IP Address has the Interface Name ( |
(NNMi Advanced) The capabilities in the following table identify how the interface is participating in a Link AggregationProtocols used on Switches to configure multiple Interfaces (Aggregation Member Interfaces) to function as if they were one (an Aggregator Interface). When two Aggregator Interfaces establish a connection, that connection is an Aggregator Layer 2 Connection. The Aggregator Layer 2 Connection appears on Layer 2 Neighbor View maps as a thick line with an Interface icon at each end (representing the Aggregator Interface). or Split Link AggregationLink Aggregation with more than two endpoints. Some vendors refer to this as Multi-Chassis Link Aggregation, SLAG, MLAG, or MC-LAG..
| Unique Key | Capability | Description |
|---|---|---|
com.hp.nnm.capability.lag.aggregator
|
Aggregator Interface |
Indicates the interface represents a collection of participating interfaces at one end of an Aggregator Layer 2 Connection. See Layer 2 Neighbor View Map Objects for more information. |
com.hp.nnm.capability.lag.member
|
Aggregation Member |
Indicates the interface is a physical interface that is a member of an Aggregator Interface. See Layer 2 Neighbor View Map Objects for more information. |
(NNMi Advanced) The capabilities in the following table are used when Link AggregationProtocols used on Switches to configure multiple Interfaces (Aggregation Member Interfaces) to function as if they were one (an Aggregator Interface). When two Aggregator Interfaces establish a connection, that connection is an Aggregator Layer 2 Connection. The Aggregator Layer 2 Connection appears on Layer 2 Neighbor View maps as a thick line with an Interface icon at each end (representing the Aggregator Interface). or Split Link AggregationLink Aggregation with more than two endpoints. Some vendors refer to this as Multi-Chassis Link Aggregation, SLAG, MLAG, or MC-LAG. protocol is available.
| Unique Key | Capability | Description |
|---|---|---|
com.hp.nnm.capability.lag.protocol.lacp
|
802.3ad Link Aggregation Control Protocol | Indicates an interface using the IEEE 802.3ad Link Aggregation Control protocol (LACP). |
com.hp.nnm.capability.lag.protocol.static
|
Static/Manual Configured Link Aggregation | Indicates the device has been configured with Static/Manual Configured Link Aggregation (static). |
com.hp.nnm.capability.lag.protocol.pagp
|
Cisco Port Aggregation Protocol | Cisco Systems Port Aggregation Protocol (pagp) |
com.hp.nnm.capability.lag.protocol.mlt
|
Nortel Multi-Link Trunking | Nortel Multi-Link Trunk technology (mlt) |
com.hp.nnm.capability.lag.protocol.istmlt
|
Inter-Switch Trunk MLT | Split Multi-Link Trunk: inter-switch trunk (istMlt) |
com.hp.nnm.capability.lag.protocol.smlt
|
Split MLT | Split Multi-Link Trunk: configuration technology (splitMlt) |
com.hp.nnm.capability.lag.protocol.unknown
|
Unknown Protocol Link Aggregation | Indicates the hosting interface is a member of Link Aggregation with unknown protocol. |
[This is the context-sensitive link for the Interface Capability form.]
This form describes a capability added to the interface object by NNMi or an external application. Capabilities enable NNMi and application programmers to provide more information about a card than what is initially stored in the NNMi database.
For example, NNMi uses the capability feature to identify interfaces for which NNMi can obtain only limited information. Examples of these interfaces include Nortel interfaces as well as any interface on a non-SNMP node. To help identify these interfaces, NNMi assigns the interface the capability of com.hp.nnm.capability.iface.private.
Because the values are generated by NNMi or an external application, Capability values cannot be modified.
(NNMi Advanced - Global Network Management feature) Any Capability values added by an NNM iSPI are available on the Global Manager only if that iSPI is also running on the Global Manager.
| Attribute | Description |
|---|---|
| Capability |
Label used to identify the Capability that was added to the interface object. Interface Form: Capabilities Tab shows a list of all available Capabilities for that interface. For more information, see Interface Capabilities Provided by NNMi. |
| Unique Key |
Used as a unique identifier for the Capability. Any capability provided by NNMi begins with the prefix For more information, see Interface Capabilities Provided by NNMi. |
[This is the context-sensitive link for the Interface Form: Custom Attributes Tab.]
Custom Attributes enable an NNMi administrator to add information to the Interface object. Custom Attributes can also be set by external applications that have been integrated with NNMi. See Custom Interface Attribute Samples.
The Interface Form: Custom Attributes tab displays a table view of any Custom Attributes that have been added to the selected interface.
If your role permits, you can edit a Custom Attribute. Only users assigned to the NNMi Administrator role can add a Custom Attribute.
For information about each tab:![]() See Also
See Also
(NNMi Advanced - Global Network Management feature) Custom Attribute values can be replicated from a Regional Manager (NNMi management server) to the Global Manager. NNMi administrators for the Global Manager configure which Regional Custom Attributes they want (Global Manager: Configure Custom Attribute Replication). NNMi administrators can also configure Custom Attribute values that are unique to the Global Manager's environment (Customize Object Attributes).
| Attribute | Description |
|---|---|
| Name | Name used to identify the Custom Attribute. This name appears in the table view on the Custom Attributes tab in Interface forms. Limit 50 of any combination of keyboard entries including spaces. |
| Value |
The actual value for the Custom Attribute for the selected interface. Limit 2,000 of any combination of keyboard entries including spaces. For more information, see Custom Interface Attributes Form. |
[This is the context-sensitive link for the Interface Custom Attributes Form.]
Custom Attributes enable an NNMi administrator to add information to a node object. Custom Attributes can also be set by external applications that have been integrated with NNMi. See Custom Interface Attribute Samples.
The required settings for these attributes are described in the table below.
(NNMi Advanced - Global Network Management feature) Custom Attribute values can be replicated from a Regional Manager (NNMi management server) to the Global Manager. NNMi administrators for the Global Manager configure which Regional Custom Attributes they want (Global Manager: Configure Custom Attribute Replication). NNMi administrators can also configure Custom Attribute values that are unique to the Global Manager's environment (Customize Object Attributes).
| Attribute | Description |
|---|---|
| Name | Name used to identify the Custom Attribute. This name appears in the table view on the Custom Attributes tab in the Interface forms. Limit 50 of any combination of keyboard entries including spaces. |
| Value |
Value assigned to the Custom Attribute for the selected interface object. Limit 2,000 of any combination of keyboard entries including spaces. For more information, see Interface Form: Custom Attributes Tab. |
[This is the context-sensitive link for the Interface Custom Attributes Form.]
Custom Attributes provide additional information about an object instance:
-
NNMi administrators can associate custom information with the Interface for their network management team's benefit.
For example, your NNMi administrator might have added the following:
- Name:
Assignment - Value:
WAN interface to the London office.
- Name:
-
External applications that have been integrated with NNMi can associate custom information with the Interface.
For example, when Network Node Manager iSPI Performance for Metrics Software is installed, your NNMi administrator can provide additional Node or Interface information in NNM iSPI Performance for Metrics reports:
- Name =
NPS Annotation - Value =
<text to appear in the reports>.
See the help topic: Annotate NNM iSPI Performance for Metrics Reports.
- Name =
-
NNMi can associate custom information about an Interface.
For example, if the NNMi administrator enables the Discovery and Monitoring of unnumbered interfaces, you will see this Custom Attribute associated with each unnumbered interface:
- Name:
UnnumberedNextHop -
Value:
<IP address of the neighboring device>
- Name:
(NNMi Advanced - Global Network Management feature) Custom Attribute values can be replicated from a Regional Manager (NNMi management server) to the Global Manager. NNMi administrators for the Global Manager configure which Regional Custom Attributes they want (Global Manager: Configure Custom Attribute Replication). NNMi administrators can also configure Custom Attribute values that are unique to the Global Manager's environment (Customize Object Attributes).
[This is the Context-Sensitive Help topic for the Interface form, Interface Groups tab.]
The Interface Form provides details about the selected network interface.
For information about each tab: ![]() See Also
See Also
| Attribute | Description |
|---|---|
| Interface Groups |
Table view of Interface Groups to which the selected interface belongs. Interface groups are based on specific characteristics of interfaces. Double-click the row representing an Interface Group. The Interface Group Form displays all details about the selected Interface Group. |
[This is the Context-Sensitive Help topic for the Interface form, Incidents tab.]
The Interface Form provides details about the selected network interface.
For information about each tab: ![]() See Also
See Also
| Attribute | Description |
|---|---|
| Associated Incidents |
Table view of the incidents associated with the selected interface. These incidents are sorted by creation time so that you can view the incidents in chronological order. Use this view to determine which incidents are still open for the selected interface. Double-click the row representing an incident. The Incident Form displays all details about the selected incident. |
[This is the Context-Sensitive Help topic for the Interface form, Status tab.]
The Interface Form provides details about the selected network interface.
For information about each tab: ![]() See Also
See Also
| Attribute | Description |
|---|---|
| Status History |
List of up to the last 30 changes in the status for the interface. This view is useful for obtaining a summary of the interface status so that you can better determine any patterns in behavior and activity. Double-click the row representing a Status History. The Status History form displays all details about the selected Status. |
[This is the Context-Sensitive Help topic for the Interface form, Conclusions tab.]
The Interface Form provides details about the selected network interface.
All relevant conclusions are shown in the table on this tab. The most severe Status in the current group of conclusions becomes the overall Interface status. Some Interface conclusions propagate to other object types: ![]() See Also
See Also
For information about each tab: ![]() See Also
See Also
| Attribute | Description | ||||||||||||||||||||||||||||||||||||||||||||||||||||||||||||||||||||||||||||||||||||||||||||||||||||||||||||||||||||||||||||||||||||||||||||||||||||||||||||||||||||||||||||||||||||||||||||||||||||||||||||
|---|---|---|---|---|---|---|---|---|---|---|---|---|---|---|---|---|---|---|---|---|---|---|---|---|---|---|---|---|---|---|---|---|---|---|---|---|---|---|---|---|---|---|---|---|---|---|---|---|---|---|---|---|---|---|---|---|---|---|---|---|---|---|---|---|---|---|---|---|---|---|---|---|---|---|---|---|---|---|---|---|---|---|---|---|---|---|---|---|---|---|---|---|---|---|---|---|---|---|---|---|---|---|---|---|---|---|---|---|---|---|---|---|---|---|---|---|---|---|---|---|---|---|---|---|---|---|---|---|---|---|---|---|---|---|---|---|---|---|---|---|---|---|---|---|---|---|---|---|---|---|---|---|---|---|---|---|---|---|---|---|---|---|---|---|---|---|---|---|---|---|---|---|---|---|---|---|---|---|---|---|---|---|---|---|---|---|---|---|---|---|---|---|---|---|---|---|---|---|---|---|---|---|---|---|---|
| Outstanding Status Conclusions |
The dynamically generated list of summary statuses of the interface that contributed to the current overall status of the selected interface. Status is set by the Causal Engine. Each Conclusion listed is still outstanding and applies to the current overall Status. This view is useful for obtaining a quick summary of the Status and problem description for the current node’s interfaces that led up to the interface’s most current Status. The Status value is correlated based on the most critical Conclusions. Double-click the row representing a Conclusion. The Conclusion form displays all details about the selected Conclusion. The following table describes the possible Conclusions that might appear for an interface object. A Y in the Incident? column indicates that the Conclusion results in an incident. Critical Status Conclusions
Major Status Conclusions (NNM iSPI Performance for Metrics)
Minor Status Conclusions Warning Status Conclusions (NNM iSPI Performance for Metrics)
Warning Status Conclusions (NNMi Advanced)
Disabled Status Conclusions Unknown Status Conclusions
Normal Status Conclusions
|
||||||||||||||||||||||||||||||||||||||||||||||||||||||||||||||||||||||||||||||||||||||||||||||||||||||||||||||||||||||||||||||||||||||||||||||||||||||||||||||||||||||||||||||||||||||||||||||||||||||||||||
[This is the Context-Sensitive Help topic for the Interface form, Registration tab.]
The Interface Form provides details about the selected network interface.
For information about each tab: ![]() See Also
See Also
| Attribute | Description |
|---|---|
|
Created |
Date and time the selected object instance was created. NNMi uses the locale of the client and the date and time from the NNMi management server. This value does not change when a node is rediscovered. This is because the Node object is modified, but not created. |
|
Last Modified |
Date the selected object instance was last modified. NNMi uses the locale of the client and the date and time from the NNMi management server. Note the following:
|
| Attribute | Description |
|---|---|
|
ID |
The Unique Object Identifier, which is unique within the NNMi database. |
|
UUID |
The Universally Unique Object Identifier, which is unique across all databases. |
When the Interface Form provides details about a virtual switch, two additional tabs appear:
- Uplinks
- Virtual Ports
The virtual switch is identified with the Virtual Bridge capability (see Interface Form: Capabilities Tab).
You can launch the virtual switch's Interface form from the following locations:
- A table of Interfaces
- A map view by double-clicking the
 Switch icon
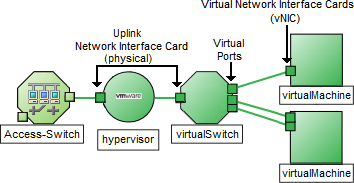
For additional information about the hypervisorThe virtual machine manager in charge of delegating various aspects from a pool of resources to become virtual devices. The delegations might be static or dynamic, depending on the manufacture's implementation. The type of virtual machines being generated depends on the manufacturer's implementation. providing this virtual switch, see:
For information about each tab: ![]() See Also
See Also
| Attribute | Description |
|---|---|
| Name | The most accurate interface name available to the initial discovery process. First choice is the IF MIB ifName value. Second choice is the ifAlias value. Third choice is a combination of the ifType[ifIndex] value (for example, ethernetCsmacd[17]).
|
| Status |
Overall status for the current interface. NNMi follows the ISO standard for status classification. See the Interface Form: Status Tab for more information. Possible values are:
Interface status is derived from SNMP polling results for ifAdminStatus and IfOperStatus, as well as from any conclusions. Status reflects the most serious outstanding conclusion. See the Interface Form: Conclusions Tab for information about how the current status was determined. See Watch Status Colors for more information about possible status values. The icons are displayed only in table views. |
| Management Mode |
The calculated Management Mode for the interface according to the Management Mode Hierarchy. This value reflects the current management mode of this interface's parent object (the Hosted On Node). See How NNMi Assigns the Management Mode to an Object. (NNMi Advanced - Global Network Management feature) Any change to this Management Mode setting is sent from a Regional Manager to the Global Manager during the next Spiral Discovery cycle on the Regional Manager. If the NNMi Security configuration permits, you can change this setting using Actions → Management Mode.You can also right-click any object in a table or map view to access the items available within the Actions menu. |
| Direct Management Mode |
Indicates whether or not NNMi is currently monitoring the interface. Possible values are:
NNMi administrators and Level 2 Operators can use the drop-down selection list to change the current setting. If you change the Direct Management Mode using Actions → Management Mode, NNMi updates the calculated Management Mode on the form. If you manually set the Direct Management Mode and then Save your changes, the Management Mode value is not updated until you refresh the form. |
| Hosted On Node |
The node in which the interface resides. This is the current value in the NNMi database for the Name attribute of the host device. The value could be a DNS name, a MIB-II sysName, or an address (depending on how your NNMi administrator configured the discovery process). Click the |
| Physical Address |
The interface address at the physical layer, also known as the MAC address. This is the globally unique serial number assigned to each interface at the factory. |
| Layer 2 Connection |
Used to indicate whether the selected interface is part of a Layer 2 Connection. If the interface is part of a connection, use this attribute to access information about its Layer 2 Connection and the neighboring device. Click here for instructions.
|
| Attribute | Description |
|---|---|
| Administrative State |
The current Administrative State provided by:
This value contributes towards the status calculation for this interface. See the Interface Form: Status Tab for more information. Possible values are:
The following values indicate NNMi could not gather the required data:
|
| Operational State |
The current Operational State provided by:
This value contributes towards the status calculation for this interface. See the Interface Form: Status Tab for more information. Possible values are:
The following values indicate NNMi could not gather the required data:
|
| State Last Modified |
(NNMi Advanced - Global Network Management feature) The text you enter here is not sent from a Regional Manager (NNMi management server) to the Global Manager. NNMi administrators for the Global Manager can add notes that are stored in the NNMi database on the Global Manager. The date and time when the Administrative State, Operational State, or both were last modified. |
| Notes |
Provided for network operators to use for any additional notes required to further explain the interface. Information might include to what service or customer the interface is connected. Type a maximum of 1024 characters. Alpha-numeric, spaces, and special characters (~ ! @ # $ % ^ & * ( ) _+ -) are permitted. You can sort your interface table views based on this value. Therefore, you might want to include keywords for this attribute value. |
[This is the Context-Sensitive Help topic for the Interfaces form, Uplinks tab.]
The Interface Form provides details about the selected interface.
The Uplinks tab appears only for those interfaces that represent virtual switches. Use this tab to view the list of physical interfaces associated with that virtual switch. These interfaces are identified using the Virtual Bridge Port capability.
For information about each tab: ![]() See Also
See Also
|
Attribute |
Description |
|---|---|
|
Interfaces |
Table view of all of the interfaces representing the uplink associated with the virtual switch. Double-click the row representing an interface. The Interface Form displays all details about the selected interface. |
[This is the Context-Sensitive Help topic for the Interface form, Virtual Ports tab.]
The Interface Form provides details about the selected network interface.
The Virtual Ports tab appears only for those interfaces that represent virtual switches. Use this tab to view the list of virtual interfaces on the virtual switch that connect to virtual machineA device that utilizes components from multiple physical devices. Depending on the manufacture's implementation, the virtual machine may be static or dynamic. nodes. Virtual Ports are identified using the Virtual Bridge Port capability.
For information about each tab: ![]() See Also
See Also
|
Attribute |
Description |
|---|---|
|
Ports |
Table view of all of the virtual interfaces that connect to a virtual switch. Use this table to access information about each virtual interface associated with the selected virtual switch. Double-click the row in the Virtual Ports table. The Interface Form displays all details about the selected virtual interface that is acting as a virtual port. |
Related Topics: