


Use Baselines
This topic includes the following sections:
- List of Metrics for Baselines
- Step-by-Step Procedure to Configure a Baseline
- How the NNMi Calculates Baselines
The NNMi is capable of monitoring network elements by using a calculated baseline for use in reporting, forecasting, and thresholds. You can use deviation from historical baseline as a threshold (instead of a fixed threshold value). Baselines are calculated based on previously collected values for each network element, taking into account variations based on the time of the day and the day of the week. The NNMi creates exceptions and sends incidents to the NNMi Incident View when the monitored metric value violates the baseline threshold.
Baselines provide effective monitoring of network elements for which the pattern of usage varies over a period of time. For example, network usage during peak business hours is much higher than the network usage on weekends.
While using a baseline, the NNMi uses the following workflow:
- Analyzes the historical data (all the data samples polled over the monitoring cycle)
-
Computes a baseline for the metric by using the Triple Exponential Smoothing technique:
Key features of the smoothing technique used by the NNMi:
- Uses an initialization period of three weeks from the start of the monitoring; during this period, no incidents are generated
- Uses a seasonality cycle of one week (with 5-minute granularity)
-
Uses the number of deviations (above and below) from the values specified in the Baseline Settings form to compute the range of normal values or the baseline sleeve
For more information, see "How the NNMi Calculates Baselines".
-
Determines exceptions; you can view these exceptions by choosing the special baseline exception count and baseline exception rate metrics on reports.
- Sends incidents to the Incident View of the NNMi console.
For an example, see "Example".
List of Metrics for Baselines
Irrespective of which network element (node or interface) you choose, all of the following metrics appear in the Baseline Settings form. You must carefully choose only the relevant metrics.
| Metric | Interface/Node Monitoring | Description |
|---|---|---|
| Input Utilization | Interface | The total number of incoming octets traversing the interface as a percentage of the total possible number of octets (based on the ifSpeed value). From Interface to Interface, the exact MIB variables queried vary based on interface speed and whether the system supports the high speed counters for interfaces. Each interface in an Interface Groups has its utilization calculated by taking the total traffic on all administratively up interfaces in the group and dividing that by the total possible bandwidth. |
| Output Utilization | Interface | The total number of outbound octets traversing the interface as a percentage of the total possible number of octets (based on the ifSpeed value). From Interface to Interface, the exact MIB variables queried vary based on interface speed and whether the system supports the high speed counters for interfaces. Each interface in an Interface Group has its utilization calculated by taking the total traffic on all administratively up interfaces in the group and dividing that by the total possible bandwidth. |
|
Backplane Utilization |
Node | Percentage of backplane usage in relation to the total amount of backplane resources available. |
| Buffer Utilization | Node | Percentage of buffer usage in relation to the number of buffers available. |
| CPU 1Min Utilization | Node | Percentage of CPU usage in relation to the total amount of CPU available. This percentage is measured at 1-minute intervals. |
| CPU 5Min Utilization | Node | Percentage of CPU usage in relation to the total amount of CPU available. This percentage is measured at 5-minute intervals. |
| CPU 5Sec Utilization | Node | Percentage of CPU usage in relation to the total amount of CPU available. This percentage is measure at 5-second intervals. |
| Disk Space utilization | Node | Percentage of disk space usage in relation to the total amount of disk space available. |
| Memory Utilization | Node | Percentage of memory usage in relation to the total amount of memory available. |
| Management Address ICMP Response Time | Node | Indicates the Internet Control Message Protocol (ICMP) response time (in milliseconds) from the management station to the target node. |
If the monitored node contains multiple objects (like CPUs), the NNMi computes the baseline against the aggregate of the group of objects.
Step-by-Step Procedure to Configure a Baseline
- Log on to the NNMi console as an administrator.
- Click Configuration > Monitoring Configuration. The Monitoring Configuration form opens.
-
Go to the Interface Settings or Node Settings tab, select the interface or node group for which you want to configure a baseline, and then click
 Open. The Interface Settings or Node Settings form opens. If monitoring settings are not already configured for the group, fill out the forms in the left pane.
 If you want to create a baseline for input or output utilization, make sure to select the Enable Interface Performance Polling check box. To create baselines for any other metrics (see "List of Metrics for Baseline Thresholds"), make sure to select the Node Performance Polling check box.
- In the Interface Settings or Node Settings form, go to the Baseline Setting tab.
-
Click
 New.The Baseline Setting form opens.
 - In the Baseline Threshold Settings section, specify the details with the help of Table: Baseline Settings.
- In the Baseline Deviation Settings tab, specify the details with the help of Table: Baseline Deviation Settings.
| Attribute | Description |
|---|---|
| Monitor Attribute | Select a metric from the Monitored Attribute list (one of the metrics listed in "List of Metrics for Baseline Thresholds"). |
| Threshold Enabled |
Select this option if you want to send incidents to the NNMi's Incident View. If you do not select this check box, the NNMi does not send incidents in NNMi's Incident View. However, you can still monitor exceptions with the help of reports. |
| Durationa |
Designate the minimum time within which the value must remain out of the configured Baseline Range before the state changes to Abnormal Range and (optionally) an incident is generated. Use the Baseline Deviation Settings tab to set the upper and lower limits of the baseline range. Note the following:
|
| Duration Windowa |
Designate the window of time in which the Upper Baseline Limit or Lower Baseline Limit criteria must be met. The value must be greater than 0 (zero) and can be the same as the Duration value. |
aThe Duration and Duration Window values are used for detecting exceptions and sending incidents to the NNMi Incident View. If you select a duration of A seconds and a duration window of B seconds (A<B), the NNMi registers an exception and triggers an incident when the metric value lies outside of the calculated baseline sleeve for A seconds (or longer) during the last B seconds. For more details, see "Example".
After configuration is complete, the NNMi starts computing the baselines by using the collected data. During the initialization period (the first three weeks), you will not see any exceptions.
Use Reports to Monitor Exceptions
The NNMi generates exceptions when a metric value is found to exceed the baseline sleeve. You can view those incidents in the Incident View in the NNMi console. In addition, you can use NPS reports to monitor exceptions detected by the NNMi. Ideal reports to monitor exceptions are:
- Top N or Top N Chart: Shows Top N elements that reported most exceptions
- Chart Details: Shows a time-series chart to indicate total count of exceptions
To monitor exceptions:
- Log on to the NPS console.
- From the navigation pane, launch a report of your choice.
- Click Options.
- Select one of the metrics listed in Table: Metrics for Monitoring Exceptions.
- Click Confirm Selection.
Use Reports to Monitor Baselines
The NNMi enables you to monitor the baseline with the help of the Baseline Sleeve report to monitor baselines. This report highlights the baseline sleeve on a line graph and shows a table that lists the lower and upper limits at each display grain.
To monitor a baseline sleeve:
- Log on to the NPS console.
- From the navigation pane, launch the Baseline Sleeve report.
- Click Options. This prompt enables you to choose one of the metrics that was configured for baselining during interface or component monitoring configuration.
- Click Confirm Selection. The report shows a line graph of the selected metric and highlights a range of values that is computed as the baseline sleeve for the selected period of time.
You can also launch other reports like Top N or Chart Details to monitor different characteristics of the baseline for the monitored metric. Table: Metrics to Monitor the Baseline provides a list of metrics that help you monitor baseline characteristics.
| Metric | Description |
|---|---|
| Baseline Average |
Average value presenting the normal (expected) range of utilization for the selected topology filter based on the historical data Can analyze the following using this metric:
|
| Baseline Deviation |
Deviation of the samples spread over a specific time range. Represents the extent of the range of values normally seen for the selected time range in the seasonal cycle, based on historical data. Can analyze the following using this metric:
|
| Lower Threshold | The lower deviation configured in the Baseline Settings form. |
| Upper Threshold | The upper deviation configured in the Baseline Settings form. |
| Upper Normal |
Upper limit of the normal range for the sample. The normal range for the sample may vary for every iSPI Performance product. NNMi supplies the upper normal value based on values that you enter in the Threshold Configuration form. You can disable the upper normal value if you do not require to set the upper threshold for the metric. See the Network Node Manager i Software Online Help for Administrators for information about the Threshold Configuration form. The value is calculated using the following formula: Upper Normal = Baseline Average + (N1 * Baseline Deviation) where N1 is the upper sleeve width |
| Lower Normal |
Lower limit of the normal range for the sample. The normal range for the sample can vary for every iSPI Performance product. NNMi supplies the lower normal value based on values you enter in the Threshold Configuration form. You can disable the lower normal value if you do not set the lower threshold for the metric. See the Network Node Manager i Software Online Help for Administrators for information about the Threshold Configuration form. The value is calculated using the following formula: Lower Normal = Baseline Average - (N2 * Baseline Deviation) where N2 is the lower sleeve width |
| Days to Threshold |
Forecast for the topology element utilization to reach the upper or lower threshold limit. Represents the number of days left for the utilization to reach the threshold value. NPS calculates this metric based on the following:
|
Example
-
Configure a baseline threshold for nodes in the NNMi Baseline Setting configuration form.
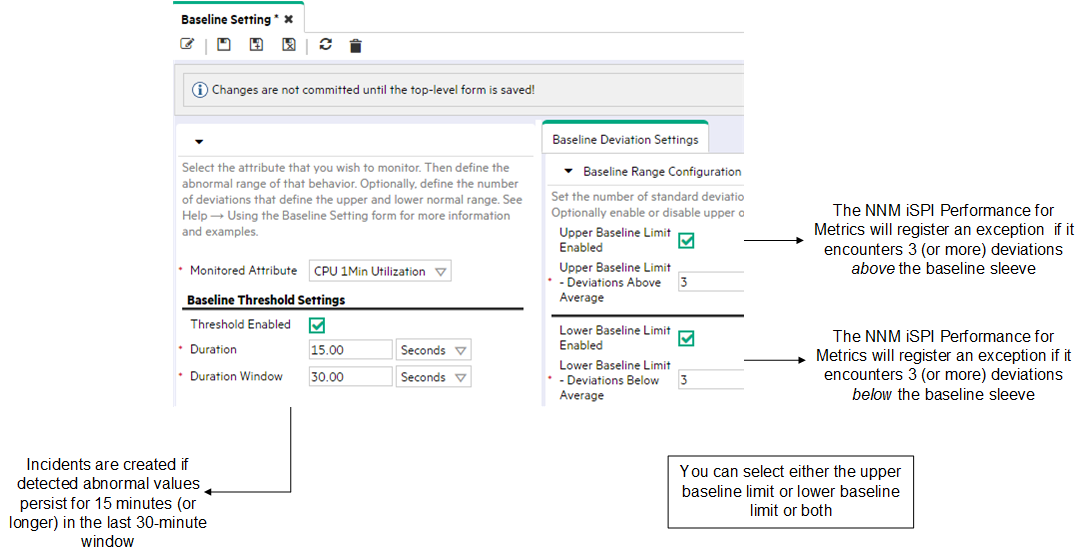
-
Select CPU 1Min Utilization as the monitored attribute.
-
Select Threshold Enabled.
This selection enables the NNMi to send incidents to the NNMi Incident View.
- Type a duration of 15 minutes.
-
Type a duration window of 30 minutes.
Because of this configuration, the NNMi will send incidents to the NNMi Incident View if an exception persists for 15 minutes of the last 30-minute window.
- In the Baseline Deviation Settings tab:
- Select the Upper Baseline Limit Enabled check box.
- Type 3 for the deviation above average.
- Select the Lower Baseline Limit Enabled check box.
Type 3 for the deviation below average.
You can choose either the upper baseline limit or lower baseline limit or both.
-
-
After the initialization period (three weeks), launch the Baseline Sleeve Component Health report and view the baseline.

-
When the NNMi detects a metric value that lies outside of the baseline sleeve for 15 minutes or longer within the last 30-minute window, the NNMi raises an exception and sends an incident to the NNMi Incident View. You can view these exceptions on a Chart Detail report by selecting the
CPU 1Min Utilization - Baseline Exception Countmetric.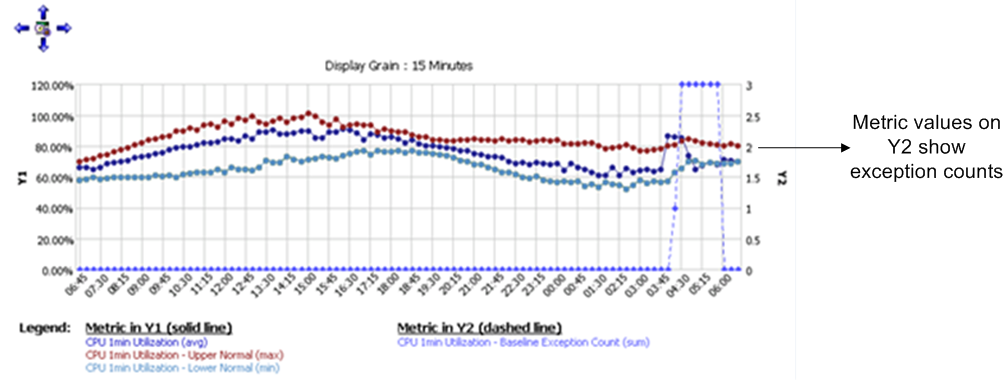
How the NNMi Calculates Baselines
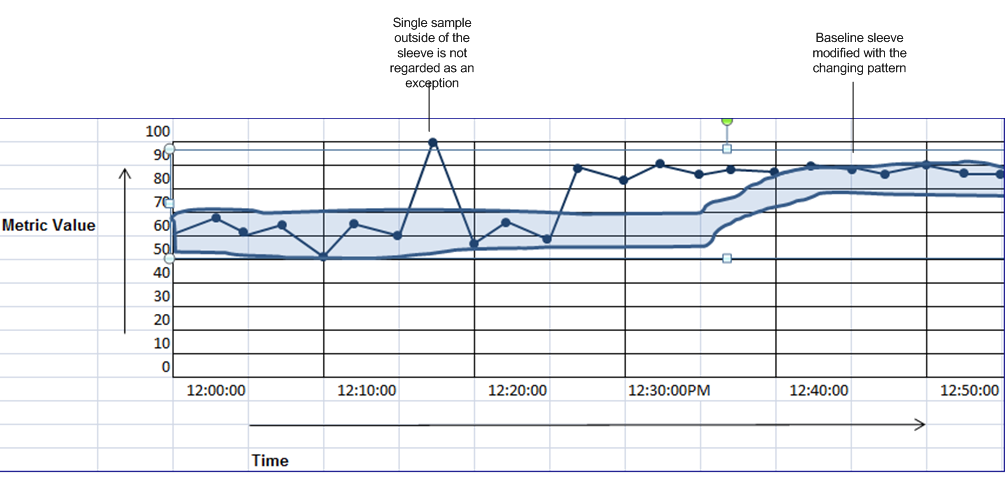
A baseline characterizes the normal pattern of behavior for the time series of the monitored metric instance. The upper and lower limits that define the normal operating range are derived from the baseline and deviation values. The normal operating range is also referred to as the baseline sleeve.When the detected metric value lies outside of the baseline sleeve, an exception is detected.
The width of the baseline sleeve is a multiplier function of the historical deviation observed in the data; that is, if historically the values do not vary much, the sleeve remains narrow; if the values vary greatly, the NNMicreates a wider sleeve. The multiplier chosen can be used to tune the selectivity of the range–a multiplier of 2 captures about 95% of samples; a multiplier of 3 captures 99% of samples.
Because the baseline sleeve defines the range of values that are considered normal, the process of exception detection must define abnormal samples as the samples that lie outside of the sleeve. To reduce the number of false alarms, this process does not classify every abnormal sample as an exception. The sleeve width of 3 deviations (or, in other words, a sleeve calculated with a multiplier of 3) captures 99% of samples, which means, 1% of the samples lie outside of the sleeve.
When abnormal values persist for a long time, a new "normal " value is determined as the baseline and the baseline sleeve changes.
Triple Exponential Smoothing Technique
The NNMi uses the Triple Exponential Smoothing technique to calculate baseline. This technique is used to predict the expected current value in a time series with the help of the previous value and the previous prediction.
y1, ..., yt-1, yt is a time series.
ýt is the predicted value at time t.
ýt= αyt-1+ (1-α)ýt-1
ýt is the weighted average of the previous sample in the time series and the previous prediction. The calculation of ýt is based on the principle that the most recent sample is the most relevant sample for making predictions. A sample becomes less relevant with age. The weight of a sample in calculating the prediction decays exponentially over time and eventually becomes insignificant.
The Triple Exponential Smoothing technique assumes that the time series can be broken down into three components:
- The overall mean smoothing component or intercept (at)
- The trend smoothing component (bt)
- The seasonal smoothing component for changing seasonal patterns (ct)
The prediction ýt is the sum of the above three components:
ýt = at + bt + ct
Each component (at, bt, and ct) is calculated with the exponential smoothing technique:
-
Intercept component = weighted average. of de-seasonalized sample and the previous intercept + previous trend
at= α(yt - ct-s) + (1-α)(at-1 - bt-1)
-
Trend component = weighted average of the difference between the current and the previous intercepts and the previous trend.
bt= β(at - at-1) + (1 - β)bt-1
-
Seasonal component = weighted average of the difference between the current sample and the current intercept and the seasonal component from the previous season
ct = γ (yt - at) + (1-γ)ct-s
All three parameters (α, β, and γ) control the rate at which the baseline is modified with the changing pattern.
Lower and Upper Limits of the Baseline Sleeve
The upper (u) and lower (l) limits of the baseline sleeve are calculated by adding or subtracting a defined multiple of the historic baseline deviation to or from the baseline average.
ut = ý t+ (δ+ * dt-S); lt = t – (δ- * dt-S)
The values of δ+ and δ-(configured in the Baseline Deviation Settings tab) influence the width of the baseline sleeve. Smaller values of δ create a narrow sleeve; larger values of δ create a wide sleeve.
Seasonality and Grain
A short season length, for example, of 24 hours, fails to capture weekly patterns such as lighter workload on weekends. This can result in:
- Very wide baseline sleeve
- A baseline slanted toward the weekday average at the start of the weekend and a baseline slanted toward to weekend average at the start of the week
For calculating baselines, the NNMi uses a seasonality of 1 week with a grain of 5 minutes, and therefore, daily, as well as weekly, patterns are captured while calculating the sleeve.
Initialization
The NNMi initializes the intercept component with the value obtained from the first sample. The deviation (δ), the trend component (b), and the seasonal component (c) are initialized to zero.
The initial values influence the baseline sleeve for some time. Gradually, with the arrival of new data samples, the baseline sleeve begins to stabilize. One of the contributing factors of the seasonal component—γ—continues to change through the first three seasons, and then finally stabilizes and remain constant from the beginning of the fourth season.
Detect Exceptions
After defining the baseline sleeve as the range of normal values, the NNMi can detect abnormal samples as the ones that lie outside of the sleeve. By defining a moving window of Y samples, the NNMi detects an exception if the window contains X samples (or more). The NNMi uses a sample interval of 5 minutes (that is, for computing baselines, samples are read by the NNMi at an interval of 5 minutes).
For example, if Y is 6 (30 minutes) and X is 3 (15 minutes), the NNMi detects an exception when the abnormal behavior persists for at least 15 out of 30 minutes.