


Use Report Views
A ReportView is a snapshot of a report. You can modify the default settings (like topology attribute and time range) of a report and save the modified report as a ReportView. Instead of launching the original report and modifying the settings all over again, you can simply launch the ReportView.
Create Report Views when you want to:
- View reports that take a long time to load
- Frequently view reports that require significant customization
You can also enable the commenting option on Report Views.
By default, the NNMi provides a set of Report Views that are available for use after the NNMi installation is complete.
To create a ReportView:
- Log on to the NPS console.
- Launch a report of your choice.
- Make necessary changes to the report, if you like.
-
Optional. Enable the commenting option for the ReportView that you are going to create.
To enable the commenting option on the ReportView:
- Right-click the report in the Reports navigation pane, and then click Properties.
- Go to the Report tab.
- Click Advanced Options.
- Select Enable Comments in Saved Output Versions.
- Click OK.
- To save the report as a ReportView, click Keep this Version > Save as Report View. The Save as Report View dialog box opens.
-
In the Save as Report View dialog box, do one of the following:
- Click My Folders to save the ReportView in My Folders, and then click OK.
-
Click Select Another Location, select a pre-existing folder, and then click OK.
You can click New Folder to create a new folder if no folders exist.
- Click OK.
You can now launch the saved ReportView from the NPS navigation panel.
You cannot change the topology filter and time settings of an existing ReportView. You can, however, launch a saved ReportView first, and then use the NPS navigation panel to modify the topology filter or time setting of the report.
Create Shortcuts to Commonly Used Reports
You can quickly launch reports from the navigation panel using shortcuts.
You can create a custom shortcut folder that contains a set of Report Views with options you select.
To create a custom ReportView:
- Create a folder and name it anything you want; for example, My Report Views.
- Launch a report with filters by clicking Run with prompt.
- Create a ReportView by clicking Keep this version and Save as Report View, selecting Select another location, and selecting the folder you created.
- Provide a name for the ReportView; for example, Top 10 Nodes by Volume in Last Day.
- Repeat to create another ReportView.
Cross-Domain Report Views
While creating a cross-domain Extension Pack, NPS creates a set of predefined Report Views. To access these Report Views, click Quicklaunch ReportViews in the navigation pane. Cross-domain Report Views are listed with all other Report Views packaged with the NNMiExtension Packs under Quicklaunch ReportViews.
NPS creates the following Report Views when you generate a cross-domain extension pack:
The Top Problematic Items ReportView is essentially a Top N report that shows top 10 objects discovered on the network with highest overall exception rateThe Overall Exception Rate indicates the percentage of time in the selected time range for which the object experienced threshold exceptions or baseline exceptions or both.s. The ReportView also shows the threshold exceptionThe Threshold Exception Rate metric indicates the percentage of time for which the object experienced threshold exceptions. and baseline exceptionThe Baseline Exception Rate metric indicates the percentage of time for which the object experienced baseline exceptions. rates for each object.
Additionally, the report shows the following details:
- The object type of each object
- The extension pack where the object belongs
Threshold Exception Rate: The Threshold Exception Rate metric indicates the percentage of time for which the object experienced threshold exceptions.
Baseline Exception Rate: The Baseline Exception Rate metric indicates the percentage of time for which the object experienced baseline exceptions.
Overall Exception Rate: The Overall Exception Rate indicates the percentage of time for which the object experienced threshold exceptions or baseline exceptions or both.
For an effective analysis, use the drill-through feature on the ReportView to launch the Baseline Sleeve or Headline report to monitor baseline or threshold exceptions for an object.
Example
-
The following ReportView shows a list of objects that experienced threshold and baseline exceptions.
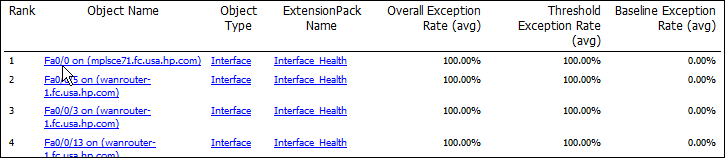
- To analyze threshold exceptions experienced by the object
Fa0/0 on (mplsec71), follow these steps:- Click the object. A new NPS console opens in a new browser tab.
In the new NPS console, open the Headline report of the Interface Health extension pack.
On this report, you can monitor threshold exceptions experienced by the
Fa0/0 on (mplsec71)object.
-
To analyze baseline exceptions experienced by the object
Fa0/0 on (mplsec71), follow these steps:- Click the object. A new NPS console opens in a new browser tab.
-
In the new NPS console, open the Baseline Sleeve report of the Interface Health extension pack.
On this report, you can monitor baseline exceptions experienced by the
Fa0/0 on (mplsec71)object.
The Days To Threshold ReportView provides a forecast analysis of threshold exceptions for all objects across all installed extension packs. This is a Top N report that shows all discovered objects on the network sorted by ascending values of the Overall Days To Threshold metric. The ReportView also shows the overall exception rate for each object.
Overall Days To Threshold: The Overall Days To Threshold metric indicates the forecasted number of days by which the object will experience threshold exception.
For an effective analysis, use the drill-through feature on the ReportView to launch the Chart Details report and select one of the forecast-specific metrics on the Chart Details report.
The Managed Inventory ReportView shows the number of instances of each topology attribute found in the collected data for all installed extension packs. This report provides a quick way of finding the count of a specific network element on the network. For example, the count of the Qualified Interface Name topology attribute shows total number of interfaces on the network.