


Use Reports
This topic includes the following sections:
- Use the NPS Console
- Report Types
- Launch Reports
- Change Report Options
- Set Topology Filters
- Change Time Settings with the Time Control Tab
- Special Scenarios
- Refresh Report Data Automatically
- Cross Launch a Report
- Create Bookmarks in Reports
- Create Bookmarks in Reportlets
- Add URL Actions in the NNMi Console
- View a Report using Different Report Formats
- Run a Report in Background
- Set Up an Email Server
- Limit Access to Reports
- Create Custom Reports with Query Studio
- Add Relative Time Queries to Custom Reports with Query Studio
- Contextual Drill-Through
- Use Cross-Domain Reports
- Adjust for Past Outages
- Use NNMi Reports to Monitor the Network
NPS generates reports on operational metrics that are collected by different NNM iSPIs and stored into the NPS database.
You can perform the following tasks with NPS reports:
- View the operational performance of metrics over a period of time.
- Modify the default settings of a report to view additional attributes related to the monitored element.
- Customize dashboards with predefined reportlets.
- Customize the schedule and format for report delivery.
- Create customized reports using Query Studio.
Avoid using Cognos BI Report Studio to create or customize NNM iSPI Performance reports. does not provide support for such reports.
Use the NPS Console
The iSPI Performance interface consists of a workspace navigation panel and a content pane.
Navigation Panel
The navigation panel provides a series of tabs that enable you to create reports. To open a tab, click ![]() the down arrow. Clicking another tab automatically closes the previously used tab. The following tabs are provided.
the down arrow. Clicking another tab automatically closes the previously used tab. The following tabs are provided.
| Tab | Description |
|---|---|
|
|
Tracks your current selection and actions and provides the Sign out link. This tab remains open. |
|
Options are:
Topology group tracking method
|

|
Enables you to set launch reports and change various options of a report. Available options are:
Additional report groups appear if you install other iSPIs or Custom Poller Extension Packs. |
|
Lists the reports that have run. To clear the list, click the Clear button. |
|
Lists the filters that have been used. To clear the list, click the Clear button. To select new filters, click the Launch Topology Selector button. For a list of filters, see Set Topology Filters. |
|
Provides options you can set to create custom reports:
To change any of the Hour of Day / Day of Week options, click the Reset button. To accept the selected options, click the Submit button. |
|
Provides access to:
|
|
Provides a direct link to the NNM console. |
Content Pane: Menu Items
| Selection | Description |
|---|---|
|
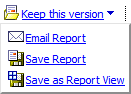
The Keep this Version menu item enable you to keep the report version that currently appears in the workspace, email it, save it as a report, or save it as a ReportView (if you are the Administrator or have permission for that option). |
|
|
Enables you to run the report selected. |
|
Enables you to view the report in various output formats: HTML, PDF, or Excel. |
Content Pane: Links
| Link | Description |
|---|---|
| Time | Opens the Time Control tab in the navigation panel. |
| Topology | Opens the Topology Filter. |
| Options | Opens the Report Options pane. |
| Show/Hide Bookmark | Displays the URL. Once opened, you can close it with Hide Bookmark. |
|
|
Opens the main page of the online help. |
Report Types
The NPS generates different types of reports with the help of the data available in its repository (column-based DBMS) and the rules defined in extension packs. Reports help you view the operational performance of metrics over a period of time. The NPS also enables you to modify the default settings of a report to view additional attributes related to the monitored element.
Calendar Report
The Calendar report uses a traditional, calendar-style layout to show hourly statistics of two metrics. When you open a report, you can view the statistics of two default metrics. You can use the options link to view the report for non-default metrics.
Chart Details
The Chart Detail report represents the actual values of two metrics at every display grain over a period of time. You can use the options link to view the report for non-default metrics.
Heat Chart
The Heat Chart (or the normalized Heat Chart) report represents the normalized values of a metric, calculated at every hour of the day, in a tabular format. The NPS uses color codes to indicate the performance characteristic of the metric in this report.
Dashboard Reports
The Dashboard Report provides an overview of the network elements available on your network by using a combination of gauges, heat charts, and ordered Top 5 lists. The focus of the report is element-based threshold breaches, which are classed as exceptions. Threshold breaches can point to a network-related problem or may indicate that your thresholds within NNMi need to be changed.
Headline Reports
The Headline Report provides a broad view of performance by presenting eight different graphs on a single page. This report enables you to view every aspect of performance at once. Use the graphs to view trends, spot-isolated spikes, exceptions, and verify that performance is meeting expectations.
Top N Reports
The Top N report displays the top ten values of the metric over the selected time range.
Top N Chart Reports
The Top N report displays the top ten values of the metric over the selected time range. In addition, the report enables you to view the graphical representation of the top ten values.
Top N Frequency Distribution Reports
The Top N Frequency Distribution report ranks network elements by the metrics you select and shows the distribution of metric values for each collected sample during the selected time range.
You can use this report as an alternative to the Top N report. In addition to providing all the details that are available on the Top N report, this report helps you see how much time the metric value has spent in each bucket.
Top N Table Reports
This report ranks network elements by the metrics you select. Unlike the Top N report, this report does not show any bar charts or time series graphs. In a large environment, NPS can generate the Top N Table report faster than it can generate the Top N report. If you want to view Top N elements in the least possible time, choose the Top N Table report instead of the Top N report.
Threshold Sleeve Reports
The Threshold Sleeve report analyzes how close the metric value is to the threshold levels. In other words, this report enables you to analyze when the metric will breach the threshold.
Baseline Sleeve Reports
The Baseline Sleeve report shows the baseline sleeve determined by NPS for the selected time range.For more information about baselines, see Use Baselines.
Peak Period Reports
The Peak Period report ranks the utilization and performance of an element during the busiest time of the selected time range.
Managed Inventory Reports
The Managed Inventory report enables you to view the number of instances of each topology attribute seen in the collected data within the selected time range. For example, if the report is run for "Last 1 Hour," you can see the number of unique values for each attribute seen in the data collected over the last hour. This report can be useful for checking the number of elements polled over any given time range.
Most Changed Reports
The Most Changed report compares performance the elements for two different (consecutive) time periods and ranks them by the amount of change. The sort order is most-changed to least-changed.
Launch Reports
You can launch reports created by NPS from the NNMi console, the NPS console, or the iSPI Performance BI Server Portal.
To launch a report from the NPS console:
Launch the NPS console.
To launch the NPS console, click Actions > NNM iSPI Performance > Reporting - Report Menu in the NNMi console.
Alternatively, to launch the NPS console directly without logging on to the NNMi console, launch the following URL:
http://<NPS_system>:9300
In this instance, <NPS_system> is the fully qualified domain name of the NPS system.
In the NPS console, select Reports in the navigation panel.
NPS presents the default, ready-to-use Self Diagnostic Extension Pack (to generate reports on the performance of NPS itself). Depending on the number of the NNM iSPI products or Extension Packs available on the NPS system, you could see many other sets of reports.
- Select a report type; for example, Chart Detail or Heat Chart.
- Modify the default report settings, if required.
To launch a report from the NNMi console with a context:
Launch the NPS console:
- From an Incident view. Right-click an incident, and then click NNM iSPI Performance > Reporting - Report Menu.
- From a Topology Map. Right-click an object, and then click NNM iSPI Performance > Reporting - Report Menu.
- From an Inventory view. Right-click an inventory object, and then click NNM iSPI Performance > Reporting - Report Menu.
The NPS console opens with the specific context (in other words, the topology attribute and Extension Pack are already selected).
- In the NPS console, select the report type from the navigation pane. The report opens with the preselected topology attribute.
To navigate back to the NNMi console:
- In the NPS home page navigation panel, click the Cross Launching tab.
Click NNMi Console.
The NNMi Console link enables you to go back to NNMi workspaces based on the topology objects currently selected in NPS.
After logging off from the NNMi console, if you want to log on again as a different user, you must clear browser cookies before launching any NPS reports.
Launch Reportlets
You can launch reportlets created by NPS or NNM iSPI products from NNMi, the NPS home page, or the iSPI Performance BI Server Portal.
To launch a reportlet from the NPS home page:
- Log on to NPS using either the NNMi console or the NPS home page.
On the NPS home page, select an Extension Pack in the navigation panel, and then expand the Reportlets folder.
- Select a reportlet type (for example, Exceptions Pie Chart or Simple Bar and Line Chart).
- Modify the default reportlet settings, if required.
Reportlet Controls Toolbar
The Reportlet page enables you to modify the reportlet properties using the following tools in the Reportlet Controls toolbar.
| Reportlet Control | Description |
|---|---|
 | Displays or hides the reportlet control toolbar |
 | Displays or hides the following information:
|
 | Displays or hides the Report Options panel. |
 | Displays or hides the Topology Filter panel. |
 | Displays a bookmark to the reportlet in a new panel. |
 | Launches the Online Help topic for the reportlet. |
Change Reportlet Settings
You can change the default settings like metrics, grouping by attribute, and topology attribute.
To change the reportlet settings, follow these steps:
- Launch the reportlet from the NPS navigation panel.
- Click Show
Toolbar.
To change reportlet options, click
Toggle Options. The Report Options panel opens.In the Report Options panel, select metrics, grouping by options, and top/bottom N values.
To use topology filters, click
. The Topology Filter panel opens.In the Topology Filter panel, select topology attributes of your choice.
NPS preserves your choice of metrics for a reportlet. When you come back to the reportlet in the future, the metrics you selected the last time are automatically used as the default metrics.
Launch Related Reports with Contextual Navigation
For easy access to related and relevant reports, NPS provides links, or contextual navigation points, on the report content to launch reports to focus on a particular element or time span. By clicking a hyperlink on the report, you can navigate to related reports with the context of the original report.
The table lists contextual navigation points for each report type.
| Report Type | Contextual Navigation Point |
|---|---|
| Calendar | X-axis: Opens report links for reports with the same Date/time context and the same primary metric. |
| Chart Detail | X-axis: Opens report links for reports with the same Date/time context and the same primary metric. |
| Heat Chart | Hour of Day Row Header: Opens report links for reports with the same Hour of Day filter of the selected row. Day of Month Header: Opens report links for reports with the same Date/Time filter of the selected row. Data cell value: Opens report links for reports with the same Hour of Day filter of the selected row and same Date/Time filter of the selected date. |
| Headline | X-axis: Opens report links for reports with the same Date/Time context and same metric. |
| Dashboard | Interface name from the Top 10 utilization, Response Time, or Discard charts: Opens report links for reports with the same topology filter to selected interface and the same metric. Needles of the Exception Count gauges: Opens report links for reports with the same metric. |
| Top N | Element name (for example, interface name or node name): Opens Top N report for the selected element with the same topology filter. |
| Most Changed | Element name (for example, interface name or node name): Opens Most Changed report for the selected element with the same topology filter. |
You can launch a report from the same Extension Pack tab, or from a different one. If you launch a report from a different Extension Pack tab, only the relevant topology filters are preserved. Because metrics vary between Extension Packs, the selected metric cannot be transferred to the target report.
Enable Contextual Navigation
You can drill through reports to see more detail on elements you choose.
The Preferences tab of the navigation panel provides the option to automatically enable drillthrough on reports you plan to run.
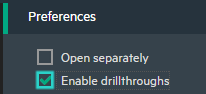
Or you can click the ![]() drillthrough icon for a report you already ran.
drillthrough icon for a report you already ran.
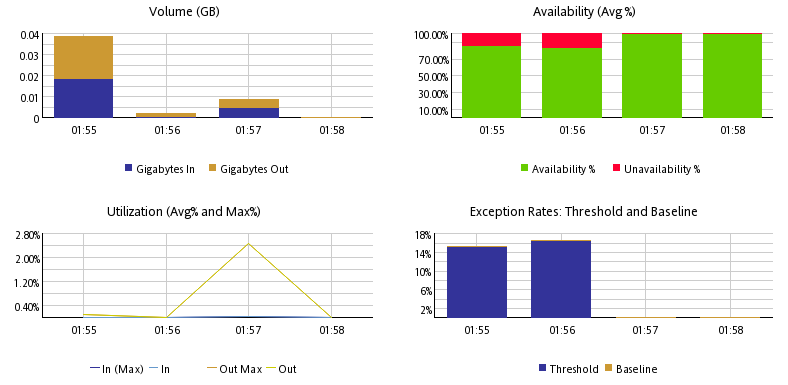
When drillthrough is enabled, you can click an area of interest within the report to get more details. For example, say that you clicked inside the following Volume graph at time 01:55.
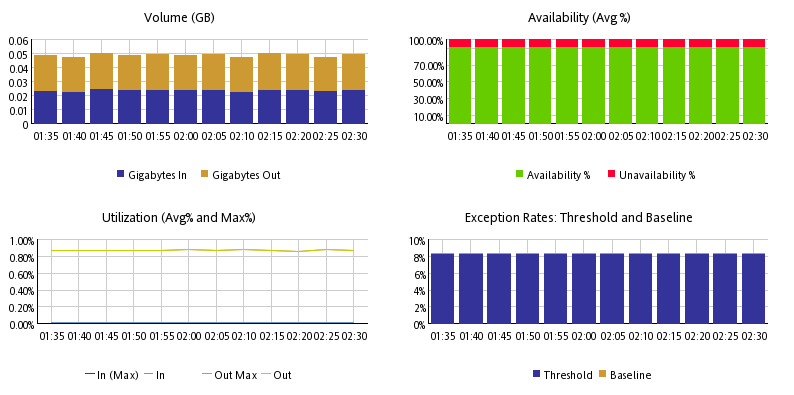
The following detail would appear for that time period.
Change Default Settings Before Launching Reports
You can change default settings like metrics, grouping by option, and topology filter before you launch the report in the NPS console.
To change report options (like metrics and grouping by options), right-click the report in the navigation pane, and then select Run with Options. The Report Options panel opens in the console.You can make necessary changes, click Confirm Selection, and then click Finish to launch the report. For more information, see Change Report Options.
To apply topology filter (or to change the existing topology filter), right-click the report in the navigation pane, and then select Topology. The Topology Filter panel opens in the console.You can make necessary changes, and then click Finish to launch the report. For more information, see Set Topology Filters.
To change the time setting, go to the Time Control panel in the navigation pane, select the time span, start time, display grain, and related settings, and then click Submit. For more information, see Change Time Settings with the Time Control Tab.
Change Default Settings
NPS generates reports with a set of parameters, which are set when you launch a report from the NPS home page or the NNMi console. However, you can use the NPS console to modify the default settings. Table: Changing Default Settings presents all the parameters that you can change on a report.
Change the Default Settings of Reportlets
Reportlets display quick impressions of larger reports using the NNMi dashboards.
NPS generates reportlets with a set of parameters, which are set when you launch a reportlet from the NPS console.
To select a new metric for the reportlet, click
Show Toolbar and  Toggle Options.
To apply topology filter, click .
Change Report Options
The NPS console enables you to change report options in multiple ways. You can click the Options link on the report or right-click the report in the navigation pane and run the report with prompts.
To change report options:
- Launch the report.
- Click Options on the report.The Report Options pane appears.
Alternatively:
Right-click the report in the navigation pane, and then click Run with Options. The report opens with the Report Options pane.
After the Report Option pane appears, you can modify report options such as the metric and Grouping By parameters. The Report Options pane presents a list of all metrics provided by the Extension Pack in a well-structured table from which you can select a metric of your choice and build a report with it.
Select a report type to see the options that you can modify.
Report Type
To modify report options, first open the Report Options pane by clicking the Options menu on the report.
Metrics
To select a metric:
Right-click the metric. You can use the search feature to find the metric of your choice. To search a metric, type the metric name in the Search box.
You can also use tagA tag is a keyword that represents an aggregation type or a domain-specific group.s to narrow down your search. To use tags, click inside the Tags box, and then select tags of your choice.
In the context menu, click Send to Y1 if you want to select this metric for the Y1 axis; click Send to Y2 if you want to select this metric for the Y2 axis. On each axis, you can select only one metric.
Click Show Description to see the metric definition.
To modify report options, first open the Report Options pane by clicking the Options menu on the report.
Metrics
To select a metric:
Right-click the metric. You can use the search feature to find the metric of your choice. To search a metric, type the metric name in the Search box.
You can also use tagA tag is a keyword that represents an aggregation type or a domain-specific group.s to narrow down your search. To use tags, click inside the Tags box, and then select tags of your choice.
In the context menu, click Send to Y1 if you want to select this metric for the Y1 axis; click Send to Y2 if you want to select this metric for the Y2 axis. On each axis, you can select up to six metrics.
Click Show Description to see the metric definition.
To remove a metric from an axis:
Right-click the metric on the axis, and then click Delete. The metric disappears from the axis.
To change the order of the metric:
Right-click the metric on the axis, and then click Move Up or Move Down. The metric changes its position on the axis and, subsequently, changes its position on the report when the report is launched.
To modify the report layout:
This drop-down list enables you to choose to view a chart or table or both on the report. Select Chart or Table or Chart and Table depending on your requirement.
To modify report options, first open the Report Options pane by clicking the Options menu on the report.
Metrics
To select a metric:
Right-click the metric. You can use the search feature to find the metric of your choice. To search a metric, type the metric name in the Search box.
You can also use tagA tag is a keyword that represents an aggregation type or a domain-specific group.s to narrow down your search. To use tags, click inside the Tags box, and then select tags of your choice.
In the context menu, click Send to Y1 if you want to select this metric. On the axis, you can select only one metric.
Click Show Description to see the metric definition.
To modify report options, first open the Report Options pane by clicking the Options menu on the report.
Grouping By:
To change the Grouping By option:
In the Grouping By list, select an attribute to define the grouping mechanism for the tabular data on the report.
To modify report options, first open the Report Options pane by clicking the Options menu on the report.
Top/Bottom N:
The Top/Bottom N list helps you specify the number of ranks that you want to see on this report.
To select data points on the report:
In the Top/Bottom N list, select a value of your choice.
To change the Grouping By option:
In the Grouping By list, select an attribute to define the grouping mechanism for the tabular data on the report.
To select more than one attribute, click  Add New Grouping. A new Grouping By box with the list of attributes appears.
To remove a grouping attribute, click  Remove Grouping.
Metrics:
To select a metric:
Right-click the metric. You can use the search feature to find the metric of your choice. To search a metric, type the metric name in the Search box.
You can also use tagA tag is a keyword that represents an aggregation type or a domain-specific group.s to narrow down your search. To use tags, click inside the Tags box, and then select tags of your choice.
In the context menu, click Send to Y1 if you want to select this metric for the Y1 axis; click Send to Y2 if you want to select this metric for the Y2 axis. On each axis, you can select up to six metrics.
Click Show Description to see the metric definition.
You can limit the number of rows on the report by specifying a range of values in the From and To boxes on each axis. After typing a value in the From or To box, you must press Enter. For the percentage type of metrics, specify values in decimal fractions. For example, to specify 9%, type 0.09.
To remove a metric from an axis:
Right-click the metric on the axis, and then click Delete. The metric disappears from the axis.
To change the order of the metric:
Right-click the metric on the axis, and then click Move Up or Move Down. The metric changes its position on the axis and, subsequently, changes its position on the report when the report is launched.
Right-clicking a metric on the Y1 or Y2 axis does not bring up any context menus when no other metrics are present on the axis.
Display Time Series Chart:
This drop-down list enables you to choose to view a time series line graph of .the Y1 metric (only the first metric on the Y1 axis) for the top or bottom N elements.
Display Table Extras:
This drop-down list enables you to choose to view additional bar charts of .the Y1 metric for the top or bottom N elements.
Top/Bottom N:
The Top/Bottom N list helps you specify the number of ranks that you want to see on this report.
To select data points on the report:
In the Top/Bottom N list, select a value of your choice.
To change the Grouping By option:
In the Grouping By list, select an attribute to define the grouping mechanism for the tabular data on the report.
To select more than one attribute, click Add New Grouping. A new Grouping By box with the list of attributes appears.
To remove a grouping attribute, click Remove Grouping.
Metrics:
To select a metric:
Right-click the metric. You can use the search feature to find the metric of your choice. To search a metric, type the metric name in the Search box.
You can also use tagA tag is a keyword that represents an aggregation type or a domain-specific group.s to narrow down your search. To use tags, click inside the Tags box, and then select tags of your choice.
In the context menu, click Send to Y1 if you want to select this metric for the Y1 axis; click Send to Y2 if you want to select this metric for the Y2 axis. On each axis, you can select up to six metrics.
Click Show Description to see the metric definition.
You can limit the number of rows on the report by specifying a range of values in the From and To boxes on each axis. After typing a value in the From or To box, you must press Enter. For the percentage type of metrics, specify values in decimal fractions. For example, to specify 9%, type 0.09.
To remove a metric from an axis:
Right-click the metric on the axis, and then click Delete. The metric disappears from the axis.
To change the order of the metric:
Right-click the metric on the axis, and then click Move Up or Move Down. The metric changes its position on the axis and, subsequently, changes its position on the report when the report is launched.
Right-clicking a metric on the Y1 or Y2 axis does not bring up any context menus when no other metrics are present on the axis.
By default, the Y2 series of metrics is disabled on this report. To use the Y2 series, select the Show Y2 Series check box.
Bucket values:
The Top N Frequency Distribution report uses bucketsA bucket represents a range of values. The Top N Frequency Distribution report enables you to define 12 different buckets (or ranges of values) for a metric series—from bucket 0 (Bkt 0) through bucket 11 (Bkt 11). Each bucket is associated with a color code (in-built, not configurable). The generated report represents the distribution of different value ranges with the color codes that are associated with buckets. to indicate different ranges of metric values.
About Buckets
A bucket represents a range of values. The Top N Frequency Distribution report enables you to define 12 different buckets (or ranges of values) for a metric series—from bucket 0 (Bkt 0) through bucket 11 (Bkt 11). Each bucket is associated with a color code (in-built, not configurable). The generated report represents the distribution of different value ranges with the color codes that are associated with buckets.
You must define the ranges by typing an upper limit in the text box provided for each bucket. The first bucket (Bkt 1) represents all values below the specified upper limit.
If you want to create evenly distributed buckets, specify the upper limit for Bkt 11 and Bkt 0, and then click Spread Values.
Since you can define buckets (value ranges) only for each metric series and not for individual metrics, you must select only related metrics in a metric series. You can use the same series and bucket ranges for percentage metrics, but do not place counter metrics (such as Volume) and percentage metrics together on the same series.
Top N:
The Top N option helps you specify the number of data points that you want to see on the report.
To change the Grouping By option:
In the Grouping By list, select an attribute to define the grouping mechanism for the tabular data on the report.
To select more than one attribute, click Add New Grouping. A new Grouping By box with the list of attributes appears.
To remove a grouping attribute, click Remove Grouping.
Metrics:
Select metrics of your choice.
To select a metric:
- Right-click the metric.
In the context menu, click Send to Y1. You can select only one metric.
Click Show Description to see the metric definition.
You can use the search feature in the Name section to find the metric of your choice. You can use tagA tag is a keyword that represents an aggregation type or a domain-specific group.s to narrow down your search.
Top/Bottom N:
The Top/Bottom N list helps you specify the number of ranks that you want to see on this report.
To select data points on the report:
In the Top/Bottom N list, select a value of your choice.
Grouping by Time Period:
In the Grouping by Time Period box, select the time period by which you want to group the peak values.
Metrics:
To select a metric:
Right-click the metric. You can use the search feature to find the metric of your choice. To search a metric, type the metric name in the Search box.
You can also use tagA tag is a keyword that represents an aggregation type or a domain-specific group.s to narrow down your search. To use tags, click inside the Tags box, and then select tags of your choice.
In the context menu, click Send to Y1 if you want to select this metric for the Y1 axis; click Send to Y2 if you want to select this metric for the Y2 axis. On each axis, you can select up to six metrics.
Click Show Description to see the metric definition.
You can limit the number of rows on the report by specifying a range of values in the From and To boxes on each axis. After typing a value in the From or To box, you must press Enter. For the percentage type of metrics, specify values in decimal fractions. For example, to specify 9%, type 0.09.
To remove a metric from an axis:
Right-click the metric on the axis, and then click Delete. The metric disappears from the axis.
To change the order of the metric:
Right-click the metric on the axis, and then click Move Up or Move Down. The metric changes its position on the axis and, subsequently, changes its position on the report when the report is launched.
Right-clicking a metric on the Y1 or Y2 axis does not bring up any context menus when no other metrics are present on the axis.
After modifying, click Confirm Selection. The modified report appears.
NPS preserves your choice of metrics for a report. When you come back to the report in the future, the metrics you selected the last time are automatically used as the default metrics.
Set Topology Filters
NPS generates reports created from different metrics that are polled from different nodes, interfaces, and other network elements. You can use the Topology Filter feature to modify the report to contain only the data polled from network elements of your choice. Topology attributes of an element show the topographical characteristics of the element on the network such as its location, group, type, and so on. The Topology Filter feature enables you to filter the complete set of discovered elements and generate reports on elements with specific topology attribute values.
All topology attributes are obtained from NNMi or the collectors and pollers of the iSPIs. You cannot add new attributes or delete existing attributes.
By default, NPS preserves the historical integrity of topology data. Any changes made to topology attributes (Interface Speed, ifAlias values, and so on) are not retroactively applied to the existing historical data, but only to new data.
To use topology filters:
Log in to NPS from either the NNMi console or the NPS home page.
In the navigation panel, open the Reports tab and select the report you want to view.
To modify the topology filters for one of the most used reports, select a report from the My Folders location or from the Extension Pack folders.
In the navigation panel, open the Topology Filter tab and click Launch Topology Selector.
Do one of the following for the topology attributes you want to filter:
To select just one value for a topology attribute, click
 Single value select, and select a value from the drop-down list.
To select multiple values, click
 Multi value select, and select the values from the drop-down list. You can click, Shift+click, Ctrl+click, click Select all, or click Deselect all.
To search and select a value from a list of values, click
 Search and select. The search dialog opens.
To apply different types of topology filters, click Apply (which will suppress the values that are irrelevant).
To discard your selection, click Reset.
Click Finish to generate your report.
Cookies are used to preserve your preferred method of selecting each topology filter. For example, if you open a single value selector for an attribute, the next time you run a report, the single value selector will already be open. Be aware that opening more selectors adds extra time to running the report.
The Self Diagnostic tab displays reports on different NPS processes with the data collected from NPS. Therefore, you cannot see any node or interface-related attributes in the Topology Filters section of any Self Diagnostic reports.
You can also exclude selected objects from the report.
Select a Topology Group Tracking Method
NPS generates reports based on topology filters and metrics. Topology filters generate reports on network elements with specific topology attributes, and display data polled from selected network elements. Metrics determine the health and performance of the selected topology elements.
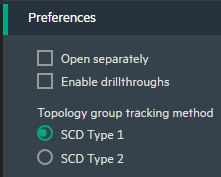
The Preferences pane provides the following topology group tracking methods:
- SCD Type1, which applies to data for which historical changes are not saved. For example, you could create a new group and use it to filter data you collected previously (prior to forming the group).
- SCD Type 2, which applies to data for which the historical changes are saved. This allows you to keep track of the interfaces and nodes that are a member of group at a certain point in time and see the reported data.
SCD (Slowly Changing Dimensions) is a term borrowed from data warehousing concepts and refers to dimensions that have data that changes slowly rather than on a regular time-based schedule.
You can define a group of topology elements and be able to look at data that was collected even before the group existed. The data for this group would be based on current group contents. In such case, you would select Type 1 as your filter.
Or you can monitor the statistics for a group of topology elements such that when the elements of the group change over time, the collected historical data is not updated to reflect the current contents of the group. You would select Type 2 as your filter.
Example
The connectivity between the routers in Site A has been suffering from a high data loss percentage for the past week. You decide to check the routers with the highest volume of incoming and outgoing traffic in this location. You create a node group for the routers in Site A and generate the Top N Report to see the list of routers with the highest volume of data. However, if you use the traditional NodeGroup Name filter to apply the node group you created today, you cannot filter older data. This means, using the default NodeGroup Name filter, you cannot display data older than the node group.
To resolve this, you can use the SCD Type 1 filter. Type 1 groups apply the most recent group definition to all the historical data. In other words, reports generated based on Type 1 topology groups display all data that matches the most recent definition of the group irrespective of the age of the data. In this example, the report, when generated based on Type 1 node group, would display past one week's data.
To select the Type 1 topology group:
In the navigation panel, click Reports and select the report you want to view.
In the navigation panel, click Preferences.
Select a Type 1 group. For example, to select a Type 1 interface group, select an interface group for the InterfaceGroup_Type1 Name topology filter. Do one of the following for the topology attributes you want to filter:
- To select just one value for a topology attribute, click Single Value Select, and select a topology filter.
- To select multiple values, click Multi value select and the topology filters (by using Ctrl-click or Ctrl+Shift).
- To search and select a value from a list of values, click Search and select.
When launching reports from NNMi with a NodeGroup or InterfaceGroup selected, the default behavior is to continue to use the traditional (Type2) "NodeGroup Name" or "InterfaceGroup Name" filters in NPS. If, however, you use the Type1 filters, you can use the Topology Filters page to clear the existing filters and apply the "NodeGroup_Type1 name" or "InterfaceGroup_Type1 Name" filters instead. The Type1 groups are also available in the Top-N reports as an element group-by option.
- To select just one value for a topology attribute, click
To apply different types of topology filters, click Apply and repeat step 3.
Clicking the Apply button suppresses the values from the other topology attributes that are irrelevant for your selection.
To discard your selection, click Reset.
- Click Confirm Selection. NPS generates the report based on the specified topology attributes.
Cookies are used to preserve your preferred method of selecting each topology filter. For example, if you open a single value selector for an attribute, the single-valued selector will already be open the next time you run a report. Avoid opening more selectors than you routinely need because they add overhead (extra time) to running the report.
Change Time Settings with the Time Control Tab
To specify a preferred time zone:
- Log on to NPS as Administrator.
- In the navigation pane, click Reports workspace, select an Extension Pack, and select a report to apply the time zone.
- In the navigation panel, click the Time Control tab.
- In the Time Zone field, select a time zone.
Click Submit.You must click Submit for the changes to take effect.
Keep in mind the following before changing the time zone.
Semi-Annual Clock Changes
If you turn clocks back 1 hour, NPS records the metrics for that hour twice, once before the time change, and once immediately after the time change. Collecting statistics twice for the same hour doubles the number of counts (volume in bytes, volume in packets) and the number of samples aggregated into an average.
But if you turn clocks ahead 1 hour, a gap of an hour occurs in the records because NPS does not collect any data sample for the missing hour. Counts for that hour will be zero, and counts for the whole day will be artificially low.Time Zones
NNMi marks performance data with a universal time stamp known as "seconds since epoch." NPS converts NNMi's universal time stamp into local time, as defined by the time zone selected for NPS. From the perspective of a user in a different time zone, NPS data will be out of sync with the local time.
If NPS and the NNMi management servers are running on separate systems, the system clocks must match.
Change Time Controls
When you launch a report from the NPS home page, the report shows the data collected over the selected time range relative to the most recent data sample.
To change time controls:
- Log on to NPS from either the NNMi console or the NPS home page.
In the navigation panel, click the Reports tab, select the Extension Pack and the report you want to view.
To modify the time controls for one of the most used reports, click My reports or select a report from one of the Extension Pack folders.
- On the navigation panel, open the Time Controlpane.
You can change the following parameters:
Time Control Function Relative Start Sets the start date for the reports based on the available data
Adjust time Adjusts the time Interval Changes the time range for the report Grain Changes the display grain for the report TimeZone Enables you to select a preferred time zone Auto Refresh Refreshes report data automatically Hour of Day Enables you to:
- Select the appropriate hour of the day from the list.
- For multiple selections, select the appropriate hour from the list, and then hold down CTRL to select each additional hour.
Day of Week Enables you to:
- Select the appropriate day of the week from the list.
- For multiple selections, select the appropriate day from the list, hold down CTRL to select each additional day.
Click Submit. If you want to cancel the Hour of Day or Day of Week selection, click Reset.
Change the Display Grain for Reports
The Time Grain defines how samples of data are grouped across the Time Range.
A 1 hour chart with a Time Grain of 5 minutes displays 12 samples of data. Adjusting the time range automatically sets the Time Grain to a default value. You can adjust the Time Grain manually using the navigation panel on the NPS home page.
To avoid partial samples of data being grouped together, NPS adjusts the Start Date/Time value to the boundary of the default time range.
To change the default time grain for the reports:
- Log in to NPS from either the NNMi console or the NPS home page.
- In the navigation panel, click Reports and select the report you want to view.
- In the navigation panel, select Time Control.
- In the Grain section, select a time grain for your report.
- Click Submit.
Your selection of Time Grain defines the data source for the reports. NPS uses the following types of data source:
Internal Aggregate tables
Using a coarse time grain (1 hour or more) ensures that your reports will source their data from the internal Aggregate tables.
Internal Raw tables
Using a fine time grain (less than 1 hour) requires NPS to analyze the volume of live data in the database and set the table type accordingly.
If the start time requested is before the earliest live data, NPS uses the internal aggregate table as the data source. Otherwise, NPS uses the internal raw table as the data source.
Time Ranges with Default Display Grains
When you set a time range for a report, a predefined display grain is applied to the report. The following table shows the mapping between the time ranges with the default display grains.
| Time Range | Display Grain |
|---|---|
| 1 Month | 1 Day |
| 1 Week | 1 Day |
| 1 Day | 1 Hour |
| 12 Hours | 15 Minutes |
| 2 Hours | 5 Minutes |
| 1 Hour | 5 Minutes |
| 30 Minutes | 5 Minutes |
| 15 Minutes | 1 Minute |
| 5 Minutes | 1 Minute |
| 1 Minute | As Polled |
Your choice of display grain defines the data source for the reports.
The following types of data sources exist within NPS:
- Raw tables (data for up to 14 days)
- Hourly tables (data for up to 70 days)
- Daily tables (data for up to 800 days)
Change the Start Date or Time for Reports
The report shows the data collected from the time and date specified in the Time Control section.
To change the start date or time for a report:
Log in to NPS from either the NNMi console or the NPS home page.
- In the navigation panel, click Reports and select the report you want to view.
- In the navigation panel, select Time Control.
- In the Relative Start field, select No.
- In the Start Date/Time section, click on the Date box, and select the appropriate date.
- In the Start Date/Time section, click on the Time box, and select the appropriate time.
- Click Submit
NPS adjusts the Start Date/Time automatically under the following circumstances:
Start Date/Time and Time Range extend beyond the available data.
NPS moves back the Start Date/Time and selects the requested Time Range from the currently available data set.
Start Date/Time requested is prior to the oldest data.
If your request for a Start Date/Time is prior to the oldest data in the system, NPS advances the Start Date/Time to coincide with the oldest data available. The Time Control advises you of this when your data set begins.
Start Date/Time is not on the boundary of the Time Grain.
NPS reports always show data grouped into sample sets. The sample size is defined by the Time Grain. If the Start Date/Time is not on the boundary of a Time Grain sized sample, results can look unusual when displayed. To prevent this, the Time Control always attempts to round down the Start Date/Time to the beginning of the nearest Time Grain sized sample.
For example, a Start Time of 12:15 a.m. and an Interval of 1 day has a default Time Grain of 1 Hour, resulting in 24 samples. However, the samples for the hour representing 12:00 only have data from 45 minutes and will appear unusually low. To correct this, the Time Control moves the Start Date/Time back to begin at 12:00 a.m. automatically.
Change the End Date or Time for Reports
The report shows the data collected from the start time until the date specified in the Time Control tab.
To change the end date or time for a report:
- Log in to NPS from either the NNMi console or the NPS home page.
- In the navigation panel, click Reports and select the report you want to view.
- In the navigation panel, select Time Control.
- In the Relative Start field, select No.
- In the End Date/Time section, click on the Date box, and select the appropriate date.
- In the End Date/Time section, click on the Time box, and select the appropriate time.
- Click Submit to generate the report for the time range ending on the date and time specified in the End Date/Time.
NPS adjusts the Start Date/Time automatically under the following circumstances:
End Date/Time and Time Range extends beyond the available data.
NPS moves back the End Date/Time and selects the requested Time Range from the currently available data set.
Time Range requested is prior to the oldest data.
If you request a time range (time between the Start Date/Time and End Date/Time) that is prior to the oldest data in the system, NPS advances the Start Date/Time and End Date/Time to coincide with the oldest data available.
The Time Control advises you of this when your data set begins.
Change the Time Range (Interval) for Reports
The time ranges fall into the following categories:
Fixed Period Length relative to the most recent sample stored on the system until now
To select this type of time range:
- Log in to NPS from either the NNMi console or the NPS home page.
- In the navigation panel, click Reports and select the report you want to view.
- In the navigation panel, select Time Control.
- In the Relative Start section, select Yes. If you select a Time Range that is relative to the most recent data (for example, Last 1 Hour), NPS modifies the Start Date/Time accordingly.
Fixed Period Length starting at the given Start Date/Time
You can select a time range applicable to a specific start and end date/time.
If you select a time range that would push the start date earlier than the available data sample, NPS automatically adjusts the time range to set the start date/time at the earliest data record.
- To select the start date or time, see Change the Start Date or Time for the Report.
- To select the end date or time, see Change the End Date or Time for the Report.
Selecting a Time Range automatically sets the Time Grain to an appropriate value. You can change the display grain manually.
Too many data points on a chart can make the results difficult to read.
Select a Relative Start for Reports
The Start Date/Time defines the point of origin of the report. The report shows the data collected from the time and date specified in the Start Date/Time field.
To set relative start for your report:
- Log in to NPS using either the NNMi console or the NPS home page.
- In the navigation panel, click Reports and select the report you want to view.
- Open the Time Control pane.
- In the Relative Start field, select Yes. By default, relative start is set to Yes.
- Select a time range for the report from the drop-down box. For example, to generate a report based on the last month's data, select 1 Month from the drop-down box.
- Select a different time grain if required.
- Click Submit.
If you request a time range that is relative to the most recent sample of data, NPS moves the Start Date/Time appropriately. In some cases, especially with a very recent installation, this can result in a Start Date/Time that appears to be older than the start of the first data collection interval.
Adjust Time
The adjust time buttons have the following function:
| Icon | Description |
|---|---|
 | Adjust time - zoom in. Enables you to view data points in a smaller time period. |
 | Adjust time - zoom out. Enables you to reset and view the original data. |
 | Adjust time - back. Enables you to view a previous time period. |
 | Adjust time - forward. Enables you to select a future time period. |
Change the Default Date and Time for Reports
To change the default date and time for reports:
- Log in to NPS from either the NNMi console or the NPS home page.
In the navigation panel, click Reports and select the report you want to view.
- In the navigation panel, click Time Control.
Select the following:
- In the Hour of Day list, select a default time for the reports.
- In the Day of Week list, select a default date for the reports.
- Click Submit.
To cancel the selection, click Reset.
Change the Default Time Zone for Reports
By default, reports are generated according to NPS's time zone. You can select a different time zone while viewing or scheduling a report in the Time Zone field.
NPS uses the selected time zone to generate all subsequent reports.
The selected time zone overrides the time zone preferences associated with your user account. If you set the time zone back to the default value, NPS uses the following time zones:
The time zone set in your user account preferences
This overrides the NPS time zone. To change the default time zone, see Change the Report Time Zone with the Time Control Tab
The time zone used by NPS
If you did not set any preference for time zone in your user account, NPS uses this option.
The Filter Summary () of each
report displays the selected time zone unless the effective time zone is the
default NPS server time zone, known as "Server Time."
Select the default time zone if you generate reports in a large scale environment. Selecting a different time zone than Server Time requires NPS to convert the time stamps for the selected time zone while generating the report. This can consume a lot of time.
Time Changes and Time Zones
Semi-annual clock changes
If you turn clocks back one hour, statistics for one hour are recorded twice, once before the time change, and once immediately after. Collecting statistics twice for the same hour doubles the number of counts (volume in bytes, volume in packets) and the number of samples aggregated into an average. If you turn clocks ahead one hour, a gap occurs because no samples are collectable for the missing hour. Counts for that hour are zero, and counts for the whole day are artificially low.
Time zones
NNM marks performance data with a universal time stamp known as seconds since epoch. NPS converts NNM's universal time stamp into local time, as defined by the location of NPS. From the perspective of a user in a different time zone, NPS data is out of sync with the local time.
If NPS and the NNMi management server are running on separate systems, make sure that the system clocks match. Otherwise, confusion will arise as you move from one application to the other.
Special Scenarios
- Start Date/Time and Time Range extend beyond the available data: The Start Date and Time automatically shift to allow the requested Time Range to be selected from the available data set.
- Start Date/Time requested is prior to the oldest data: If you request a Start Date/Time that is prior to the oldest data in the NPS, the Start Date and Time shift to coincide with the oldest data available. The Time Controls section notifies you of this after you make the selection.
- Start Date/Time is not on the boundary of the display grain: Graphs and charts always show data grouped into sample sets, with the sample size defined by the display grain. The display grain defines how samples of data are grouped across the time range. For example, a 1-hour chart with a display grain of 5 minutes displays 12 samples of data. If the Start Date/Time is not on the boundary of a display grain-sized sample, results can look unusual. The NPS always attempts to round down the Start Date/Time to the beginning of the nearest display grain-sized sample.
For example, a Start Time of 12:15 a.m. and a Time Range of 1 Day will have a default Time Grain of 1 Hour, resulting in 24 samples. However, the samples for the hour representing 12:00 will only have data from 45 minutes and will appear unusually low. To correct this, the Time Control will move the Start Date/Time back to begin at 12:00 a.m. automatically.
Refresh Report Data Automatically
The report is automatically refreshed with the fresh data samples if you select the auto refresh rate with a relative start date and time.
For example, if you selected Last 1 Hour as the Time Range, and 1 Minute in the Auto Refresh field, the report displays the data samples collected in the past hour and refreshes the data every minute. As a result, if you generated the report at 12:00 p.m., the report shows data from 11:00 a.m. to 12:00 p.m., and refreshes the report data at 12:01 p.m.
To automatically refresh the report data:
- Log in to NPS from either the NNMi console or the NPS home page.
- In the navigation panel, click Reports and select the report you want to view.
- In the navigation panel, select Time Control.
- In the Relative Start field, select Yes. By default, relative start is set to Yes.
From the Auto Refresh drop-down box, select one of the following values:
- 30 Seconds
- 1 Minute
- 5 Minutes
- I Hour
By default, Auto Refresh is set to Off.
- Click Submit
Cross Launch a Report
Where appropriate, the report or reportlet presents links to navigate to another related report or reportlet. This feature enables you to refine your selection based on time, topology, or metrics displayed on the report.
To cross launch a report or reportlet:
Click the data point in the report or reportlet that launches another report or reportlet.
For example, click a point of time in the X axis of the Chart Detail report to drill down to the Heat Chart report displaying the metric performance for the hour selected. Or, open the Top N report to see the list of devices contributing most to the data at that interval.
You can set your browser to open either a new window or a new tab when you drill down. This enables you to revisit the initial report and examine another data point at a later time.
Select the metrics for the drill-through report or reportlet.
NPS saves your selection for the next session.
Select a report or reportlet from the navigation panel. The new report or reportlet displays the selected metric.
For more information on the contextual navigation available for each report type, see Contextual Navigation.
Examples
- The Dashboard report for Interface Health shows a high availability exception count. Clicking the needle of the gauge launches the Report Menu with Availability Exceptions as the primary metric. You can then launch the Top N report to find which set of nodes is causing the availability exceptions.
- Looking at the Top N interfaces and their network discard figures, one interface seems more problematic than usual. Clicking the interface name launches the Report Menu with that interface as a topology filter. You can then launch the Chart Detail report to examine discard figures over the selected time interval for just that interface and determine when the problem started.
- Using the Heat Chart report for Interface Health shows a peak in traffic on one particular day. Clicking the cell with the high value launches the Report Menu with that day already selected. You can then launch the Interface Health Headline report and get an overview of multiple metrics for each hour during that day.
Create Bookmarks in Reports
NPS enables you to create bookmarks for reports in the NPS home page.
These bookmarks encapsulate all the selected settings (Time, filters, Options) and enable you to quickly visit the report again from your browser.
Bookmarks are convenient for emailing and sharing reports.
To have the bookmark open the report within the same time range as the original report, select a non-relative time range; for example, Start Date/Time with "1 Hour" and not "Last 1 hour" as the time range. Otherwise, the report will show the most recent data.
To create a bookmark for a report:
- Launch a report.
Click Show Bookmark. A URL appears.
Do the following:
- Only for Microsoft Internet Explorer: Click Add Bookmark. A bookmark to the report is automatically added to the browser with a new entry to the Favorites list.
- Only for Mozilla Firefox: To create a new bookmark by using the displayed URL, right-click the URL and select Bookmark This Link.
The bookmarked URL retains all the properties of the report.
Create Bookmarks in Reportlets
NPS enables you to create bookmarks for reportlets in the NPS home page.
These bookmarks encapsulate all the selected settings (Time, filters, Options) and enable you to quickly visit the reportlet again from your browser.
Bookmarks are convenient for emailing and sharing reportlets.
If you want the bookmark to open the reportlet within the same time range as the original reportlet, select a non-relative time range; for example, Start Date/Time with ‘1 Hour’ and not ‘Last 1 hour’ as the time range. Otherwise, the reportlet will show the most recent data.
To create a bookmark for a reportlet:
- Launch a reportlet.
- Click Show Toolbar
to display the reportlet toolbar.
Click
Show Bookmark. A URL appears.Do the following:
- Only for Microsoft Internet Explorer: Click Add Bookmark. A bookmark to the reportlet is automatically added to the browser with a new entry to the Favorites list.
- Only for Mozilla Firefox: Create a new bookmark by using the displayed URL.
The bookmarked URL retains all the properties of the reportlet.
Add URL Actions in the NNMi Console
After you generate a bookmark, you can create a new Actions menu item with the newly generated bookmark, which enables you to launch a report or reportlet directly from the NNMi console.
To add URL actions in the NNMi console to launch a report or reportlet:
- Generate the bookmark for the required report or reportlet.
- In the NNMi console, select the Configuration workspace from the workspace navigation panel.
- Select User Interface.
- Select Menu Items.
Click
 New.
New.The Menu Item form opens.
In the basics section of the Menu Item form, specify the following details:
- Menu Item Label: The name of the report or reportlet you want to launch.
Unique Key: A unique identifier for the menu item. Type an identifier.
You can use alpha-numeric and period (.) characters. Do not exceed 80 characters. Do not use spaces and underline characters. To make the value unique, use the Java name space convention while specifying this value. Include the Menu Item Label value as part of the unique key; for example:
com.<company_name>.nnm.menu.item.<menu_item_label>- Author: Specify the default value Customer, or click
 to add a new author name; for example, NPS.
 - Parent Menu: Retain the default value—Actions.
- Ordering: Specify an integer between 1 and 100. The lowest number appears at the top of the Actions menu. The highest number appears at the bottom of the Actions menu.
- Prepend Separator: Select this option to add a horizontal line before the report or reportlet menu item in the Actions menu.
- Enable: Select this option to use the report or reportlet bookmark.
- Retain all other default settings in the Basics section.
In the Menu Item Context tab, click
New.The Menu Item Context form opens.
In the Basics section, click
and
New Launch Action.The Launch Actions form opens.
In the Launch Actions form, specify the following:
- Name in the Name box
- Bookmark URL in the Full URL section
- Click
 Save and Close.
 - Click Save and Close in the Menu Item Context form.
- Click Save and Close in the Menu Item form.
- Click Save and Close in the User Interface Configuration form.
Now you can launch the report or reportlet from the Actions menu.
View a Report using Different Report Formats
NPS and the BI Server use web-based HTML as the default report format.
You can also view a report in Adobe PDF or Microsoft Excel formats.
To view a report in non-HTML format:
In the NNMi console, click Actions > NNM iSPI Performance > Reporting - Report Menu. The NPS home page opens.
- On the navigation panel, select the Reports tab. NPS presents the Self Diagnostic reports for the default, ready-to-use Self Diagnostic Extension Pack. Depending on the number of the NNM iSPI products or Extension Packs available on the NPS system, you could see other report folders.
- Under an Extension Pack, select a report.
- In the Time Controls tab, select a time range for the report. For information on selecting the time range for a report, see Change Time Controls.
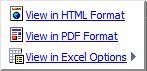
- Click
 View in HTML Format.
 Select one of the following options:
- View in PDF Format. A PDF version of the report appears in the same browser window.
- View in Excel Options and View in Excel 2007 Format, View in Excel 2007 Data, or View in CSV Format.
Run a Report in Background
Some reports can take a long time to generate. You can run such reports in the background and have the output saved to a folder on the BI Server. You can also have it emailed.
If the report takes more than a few seconds to generate, a prompt will appear offering an alternate delivery method for your report.
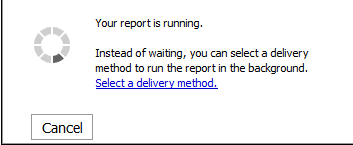
If you click Select a Delivery Method, the following screen appears:
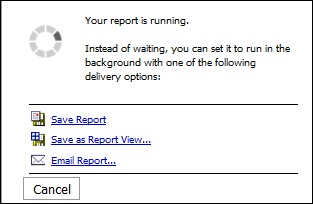
If you choose Save as ReportView, enter a name for the report and save to MyFolders or to another folder that allows you to save reports. You can then view the new ReportView at your convenience from the left-hand navigation panel.
If you choose email, enter the email fields.
Schedule Reports
You can use the BI Server Portal of the NPS console to schedule delivery of reports.
To be able to schedule reports in the NPS console, you must log on to NNMi as an administrator or Level 2 operator.
- In the navigation pane of the NPS console, click BI Server > Portal. The NNM iSPI Performance BI Portal opens.
- In the Public Folders tab, navigate to the Extension Pack of your choice.
- On the page where all the reports are listed, click More against the report of your choice. The Perform and Action page opens.
- Click New schedule.
Select the frequency (under the Frequency section) and delivery options (under the Options section). To configure delivery options, you must select Override the default values under the Options section. Do not select the XML format. Delivery of reports in the XML format is not supported. Do not select Delimited text (csv) for any reports other than Top N and Chart Detail.
- Click OK.
Set Up an Email Server
To use the NPS console to email reports, you must run the configureBIEmailServer.ovpl script one time to configure the details for your email server.
When you run the script, any existing email server information will be overwritten. Always restart the BI Server after running the configureBIEmailServer.ovpl script.
To restart the BI Server, run the following commands:
- stopBI.ovpl
- startBI.ovpl
Limit Access to Reports
The Administrator can manage access to reports that are run when a ReportView is created.
Access to such reports can be controlled in any of the following ways:
Log in as the tenant before creating the ReportView.
Create the ReportView as Administrator but delete the saved output.
Apply tenant name filtering before saving the ReportView.
Create Custom Reports with Query Studio
You can create custom reports with metrics from all available Extension Packs.
does not offer any support in using Query Studio while creating custom reports.
To create a new report:
- Log in to NPS as Administrator.
- On the NPS home page, click the BI Server tab in the navigation panel.
- Select Query Studio. The Select a package (Navigate) window opens.
Select a Public Folder.
The options are:
Cross Domain
iSPI Metrics
Quicklaunch ReportViews
Self Monitoring (admin users only)
User Groups
For example, select iSPI Metrics.
Select an Extension Pack; for example, Interface_Health.
The NNM iSPI Performance BI Query Studio window opens.
The Query Studio window consists of a Menu panel; two toolbars (Standard and Style), either of which can be hidden; and the work area where you will see your report being built.
Click Insert Data in the Menu panel to list the query items for the Extension Pack you selected.
For our Interface Health example, the options are:
- d_Interface_Health_Time
- d_InterfaceTopology
- g_InterfaceGroup Type1_InterfaceTopology
- g_InterfaceGroup Type2_InterfaceTopology
- g_NodeGroup Type1_InterfaceTopology
- g_NodeGroup Type2_InterfaceTopology
- g_MPLS L3VPN Type1_InterfaceTopology
- g_MPLS L3VPN Type2_InterfaceTopology
- g_MPLS VRF Type1_InterfaceTopology
- g_MPLS_VRF Type2_InterfaceTopology
- f_Virtual_InterfaceMetrics
- nnmdetails_Interface_Health
Select a time range as follows:
- Expand the time query item; for example, d_Interface_Health_Time.
Right-click a time range—for example, Day (of Week)—and click Insert or drag it into the work area.
The time range appears in a column in the work area. You can add more time ranges.
You can also add time dimension columns that will return relative time queries. For more instructions, see "Adding Relative Time Queries to Custom Reports with Query Studio".
To delete a time range from the work area, right-click the column for the time range, and click Delete.
Select a topology group as follows:
Expand the InterfaceTopology query item; for example, d_InterfaceTopology.
NPS displays only the topology groups associated with your security group.
Right-click a topology group and click Insert.
The attribute appears in a column in the work area.
To display meaningful data in the report, select a topology group relevant to the metrics you plan to select.
To delete an attribute from the work area, right-click the column for the attribute and click Delete.
Node groups and interface groups are separate items in the menu. To select a node or interface group, repeat the previous steps.
Add a topology context as follows:
- Expand an InterfaceGroup or NodeGroup query item.
- Right-click a group and click Insert.
The group will be added to your report.
To delete an attribute from the work area, right-click the column for the attribute and click Delete.
NPS displays all topology attributes from all installed Extension Packs. However, not all topology attributes are applicable to metrics from all Extension Packs. If you point the mouse arrow over a topology attribute, a tool tip shows the Extension Packs that support that attribute.
Select a metric for the report as follows:
- Expand the f_Virtual_InterfaceMetrics query item.
- Right-click a metric click Insert. The metric will appear in your report.
To delete a metric from the work area, right-click the column for the metric and click Delete.
- Format the report with the style toolbar.
To give your report a title:
- Click Title. The Edit title area window opens.
- Enter a title and, if you want, a subtitle.
- Click OK.
- To run the report, click Run Report in the Menu navigation panel. You will be prompted to enter a TimeZone. Enter the same value you selected when you performed the Insert Data steps.
To save the report, click Manage File in the Menu navigation panel. Select the Save As... option.
Make sure to save it in My Folder or another location. Do not save any reports made using Query Studio in any of the Extension Pack folders.
- You can view the report when you log in to the iSPI Performance BI Server Portal.
Do not use Cognos BI Report Studio to create or customize reports. does not offer support for reports created with Report Studio.
For more information on using Query Studio, see the following BI Server documents:
- Query Studio Quick Tour
- Query Studio User Guide
Add Relative Time Queries to Custom Reports with Query Studio
You can add time dimension columns to your custom report that will return relative time queries. The Date/Time dimension column provides the following time grain options:
- Month
- Week
- Day (of Month)
- Day (of Week)
- Day
- Hour (of Day)
- Hour
- Hour (epoch)
- Half Hour (of Day)
- Half Hour
- Qtr Hour (of Day)
- Qtr Hour
- 10 Minute (of Day)
- 10 Minute
- 5 Minute (of Day)
- 5 Minute
- Minute
- Minute (epoch)
- This Week
- This Day
- This Hour
- This Minute
For example, you could build a report that calculates the difference between Week and This Week.
- Launch Query Studio, select the Interface Health ExtensionPack and expand the f_Virtual_InterfaceMetrics folder.
- Select the options Week and This Week and drag them into the work area.
- To calculate the data, press Ctrl and click both column headings.
- Click the
 Calculate button. The Calculate dialog opens.
 In the Operation box, select - (difference in days). The options are:
- - (subtraction)
- - (difference in days)
- - (difference in months)
- - (difference in years)
- Add days
- Add months
- Add years
- Earliest
- Latest
- Year
- Month (number)
- Week
- Day
- Under Order, select Days between(Week, This Week) and click Insert. A new column, Days between(Week, This Week) is added to the report.
- Click the new column and click the Filter button. The Filter dialog opens.
Under From, enter 0, which represents "this week."
Under To, enter 7, which represents "last week."
A range can also be entered; for example, 0-7.
Click OK.
The value is calculated.
You can add more columns to this report. For example, you could add a measure such as Utilization (pctile95). And you can delete columns until the report reflects the information you need.
Contextual Drill-Through
NNM iSPI Performance for Metrics enables you to analyze the performance of one metric using multiple reports.
The icon and adjacent text tell you how the element and time range filters are set. Unless you modify the defaults, NPS enables the default elements and time range for the report. With the default elements and time range, the report displays every component that is delivering performance data to NNMi.
Carrying the Filter Settings Forward
The metric values that appear in reports are clickable links. When you click a metric value on a report, NPS saves the following information and opens the NPS home page:
- Selected topology filter
- Selected metrics (if available)
- Metric value that you clicked on
- Selected time range
From the navigation panel, select a report. When the report opens, the content of the new report is limited to the network elements related to the metric value you clicked in the previous report.
Preserving the context (preserving the filter and option settings when you move from one report to another) is known as contextual drill-through.
Contextual drill-through is not available if the metric value displayed on the report is NULL. If you select a component type (for example, CPU) that does not have metric values available for the selected metric (for example, Memory Utilization), the contextual drill-through link might not be enabled.
If you navigate from a summary report to a live report, only the applicable filters carry forward.
For example, a metric selection carries forward, but a Day of Week or Hour of Day setting does not carry forward to the live report because these settings do not apply to live reports. Instead, the live report opens with the time period set to the default, which is Last 15 Minutes in most cases. If you navigate from a live report to a summary report, the summary report ignores the time period you selected and instead shows data for the default time period, either Last Day or Month-to-Date.
Use Cross-Domain Reports
At the time of installing a new Extension Pack, NPS generates a cross-domain Extension Pack that combines the metrics and topology attributes of all Extension Packs that are available on the NPS system.
The cross-domain Extension Pack helps you view reports built with the data provided by all Extension Packs that are installed on the system (across all iSPIs). The cross-domain Extension Pack includes all types of standard reports and reportlets. For a list of standard reports, see Report Types.
The cross-domain Extension Pack is created and a new item (CrossDomain Reporting) appears in the navigation pane in the NPS console under Cross Domain > AllExtensionPacks > AllExtensionPacksMetrics.
In addition, the cross-domain Extension pack adds the following three Report Views in the list of Report Views:
- Top Problematic Items
- Days To Threshold
- Managed Inventory
For more information about the cross-domain Report Views, see Cross-Domain Report Views.
The cross-domain extension pack shows empty reports when the NPS database contains no data for the Component Health extension pack. Make sure the NPS database contains some data for the Component Health extension pack.
To check that the database contains data for all extension packs, run the following command on the NPS system:
dbsize.ovpl -s
NPS requires a longer time to generate cross-domain reports after you configure NPS to use a non-default time zone (using the Time Control panel).
When you launch a report from the cross-domain extension pack, you can use all metrics that are supported by installed extension packs. On a single report, you can use metrics that originally belonged to different extension packs. For example, you can choose the Utilization In (avg) metric from the Interface Health extension pack and the Number of Packets (Outgoing) metric from the Interface Traffic extension pack (provided by the NNM iSPI Performance for Traffic).
With a cross-domain report, you can use all topology attributes that are supported by installed extension packs.
The ObjectType attribute enables you to perform a filtering action on the report to view entities of a similar type (such as interfaces or components).
The ObjectName attribute enables you to perform a filtering action on the report to view specific monitored element (such as a specific node, interface, or CPU).
Adjust for Past Outages
You can use NNMi's Schedule Node Outage feature or the nnmscheduledoutage.ovpl command to schedule planned outages. After you schedule outages, NNMi changes the node status to Out-of-Service and suspends any discovery or monitoring of that node during the specified outage time period.
This feature enables you to make a record of a scheduled outage in the past. To adjust the data in the NPS database to reflect the effect of planned outages that occurred in the past, you must perform the following tasks on the NNMi management server:
- Log on to the NNMi management server.
Make sure that the following directory exists:
On Windows
%nnmdatadir%\shared\perfSpi\datafiles\outage
On Linux
/var/opt/OV/shared/perfSpi/datafiles/outages
If necessary, create the directory manually.
Create a cron job (on a Linux system) or a scheduled task (on a Windows system) to run the following command:
On Windows
%nnminstalldir%\bin\nnmscheduledoutage.ovpl dump -retroactive -start "$(date +%Y-%m)-01T00:00" -end "$(date --date='next month' +%Y-%m)-01T00:00" -format CSV > %nnmdatadir%/shared/perfSpi/datafiles/outages/$(date +%Y-%m-%d).csv
On Linux
/opt/OV/bin/nnmscheduledoutage.ovpl dump -retroactive -start "$(date +%Y-%m)-01T00:00" -end "$(date --date='next month' +%Y-%m)-01T00:00" -format CSV > /var/opt/OV/shared/perfSpi/datafiles/outages/$(date +%Y-%m-%d).csv
The cron job or scheduled task must run at least once a day.
The outage must be fully contained within the retention period of the raw/detailed data. You can check the retention period of the raw/detailed data in the Configuration Utility.
Use NNMi Reports to Monitor the Network
The Node Availability and Node Reachability metrics indicate if a node is down and if it is unable to communicate with NNMi. A report can show if a node has been down for a significant period of time.
To spot the nodes that are down:
- In the NPS console, click iSPI Metrics > Component_Health > ComponentMetrics > Top N.
On the Top N report, click Options, and make the following changes in the Report Options pane:
- Select Sort All in Ascending in the Top/Bottom 'N ' box.
- Make sure Grouping By is set to Node Name.
- Send the Node Availability (avg) metric to the Y1 pick list.
Send the Node Reachability (avg) metric to the Y2 pick list.
Delete the other (default) metrics from the pick lists.
- Click Confirm Selection.
The Top N report lists all nodes with ascending values of Node Availability (avg). Nodes that are down for at least past one hour should appear in the first few rows of the table with the Node Availability (avg) value marked as 0%. The Node Reachaility (avg) value for such nodes should be close to 0%.
You can change the Time Control settings to spot nodes that were down in the past.
Make a note of metrics (monitored attributes) for which thresholds were configured.
You can see the configuration details in the Node Settings (for nodes) and Interface Settings (for interfaces) forms. Configured metrics are listed in the Threshold Settings tab.
- In the NPS console, click iSPI Metrics > Component_Health > ComponentMetrics > Top N (for components) or iSPI Metrics > Interface_Health > InterfaceMetrics > Top N for interfaces.
On the Top N report, click Options, and make the following changes in the Report Options pane:
- Make sure the Group By option is set to Qualified Component Name or Qualified Interface Name.
In the Y1 pick list, add a threshold exception count metric.
A metric value with the
Threshold Exception Count (sum)extension represents the total count of data samples that breached the threshold value.In the Range column of the Y1 pick list, select Excluded; in the From column, type 0; in the To column, type 1.
This configuration ensures the report is going to discard all components or interfaces with no threshold breaches.
- Click Confirm Selection. The Top N report lists the components or interfaces that experienced threshold breaches in the past one hour. You can change the time range from the Time Control workspace to view threshold exceptions detected in a different time period.
- In the NPS console, click iSPI Metrics > Interface_Health > InterfacetMetrics > Top N.
On the Top N report, click Options, and make the following changes in the Report Options pane:
- Select Sort All in Ascending in the Top/Bottom 'N ' box.
- Make sure Grouping By is set to Node Name.
- Send the Node Availability (avg) metric to the Y1 pick list.
Send the Node Reachability (avg) metric to the Y2 pick list.
Delete the other (default) metrics from the pick lists.
- Click Confirm Selection.
The Top N report lists all nodes with ascending values of Node Availability (avg). Nodes that are down for at least past one hour should appear in the first few rows of the table with the Node Availability (avg) value marked as 0%. The Node Reachaility (avg) value for such nodes should be close to 0%.
You can change the Time Control settings to spot nodes that were down in the past.
Related Topics